
Introduction to LOCT for Healthcare
Welcome to LOCT for Healthcare
Supplier Leadership on Climate Transition (LOCT) for Healthcare is an online community and climate capability building program designed to empower a global community of suppliers with the skills and tools necessary to drive climate transformation and enhance global supply chain sustainability.
Our mission is to help you rapidly build a strong foundation for measuring and reducing greenhouse gas emissions. No matter where you are on your climate journey, we offer practical, actionable steps and tailored resources to support your organization’s sustainability goals.
Let’s begin this important journey together — toward a healthier, more resilient future for all.

What you will learn
- Be able to describe to colleagues why your company matters in protecting the climate
- Understand how the broader healthcare industry can catalyze climate action at scale
- Learn how to start, or continue, making climate progress
- Gain a comprehensive understanding of what the LOCT for Healthcare program entails
- Learn how to navigate the regulatory landscape and create an organizational plan to implement sustainable practices, as described by the National Academy of Medicine (NAM)
Team Formation: Your team consists of colleagues within your organization, and this feature enables collaborative discussion throughout the self-paced section.
Watch: Why It Is Important for the Healthcare Industry to Protect the Climate
Climate change is a healthcare issue. The healthcare industry is uniquely positioned to help protect the well-being of both people and the planet.

Watch the video below to learn just how important you are in protecting the climate.
Checking in on your understanding of GHGs
Which is not a greenhouse gas?
Select one answer.
In GHG accounting, the term CO2e is constantly used. What does the "e" stand for?
Select one answer.
Read: Who Developed LOCT for Healthcare?
LOCT for Healthcare was developed by Guidehouse, with input from organizations participating in the Action Collaborative on Achieving a Climate Resilient and Sustainable Health Sector (Climate Collaborative) of the National Academy of Medicine (NAM).
National Academy of Medicine
- The National Academy of Medicine (NAM) is a nonprofit organization dedicated to advancing science, informing policy, and catalyzing action to achieve optimal health for all. With input from NAM’s Climate Collaborative, this training is created to support healthcare organizations and their suppliers to make climate progress.
- While the NAM did not produce this training, it supports and recognizes the training as a valuable tool aligned with the goals of the Climate Journey Map: Supplier Pathway.
NAM Collaborative Members
- NAM Collaborative Members are health-related organizations in the Climate Collaborative, representing health and hospital systems, clinicians, private payers, biopharmaceutical and medical device companies, health care services, health professional education, academia, nonprofits, and the public sector, amongst others. Select Collaborative Members invited their suppliers to participate in LOCT for Healthcare to take action to decarbonize the healthcare supply chain.
Supplier LOCT
- Supplier Leadership on Climate Transition (Supplier LOCT) is an online community and climate capability building program designed to empower a global community of suppliers with the skills and tools necessary to drive climate transformation and enhance global supply chain sustainability. LOCT for Healthcare is a specialized offering within Supplier LOCT focused on the healthcare sector.
Reference: Complementary NAM Climate Journey Map
National Academy of Medicine Climate Journey Map
The National Academy of Medicine (NAM) leads the Climate Collaborative, an initiative designed to align participating organizations around goals and actions for addressing the health sector’s environmental impact and developing resources for the sector. As an outcome from this collaborative, NAM has established the supplier pathway of the Climate Journey Map to support healthcare suppliers decarbonize and increase sustainability efforts among organizations. LOCT for Healthcare builds upon this journey to help educate healthcare suppliers on the sustainability journey, no matter their level of climate maturity.
Reference: Your LOCT for Healthcare Journey
Your LOCT for Healthcare Journey
By the end of each chapter, your goal is to complete a key step in your climate journey.
| Chapter | Course | Goal | Complementary NAM Climate Journey Map Stage |
|---|---|---|---|
| Chapter 1 | Introduction | Set the stage, learn the “why” and “how” | Stage 1: Understanding and Navigating the Regulatory Landscape |
| Chapter 2 | Scope 1 & 2 Footprinting | Develop a Scope 1 & 2 footprint | Stage 3: Tackling Scope 1 & 2 Emissions |
| Chapter 3 | Scope 3 Footprinting | Develop a Scope 3 footprint | Stage 4: Tackling Scope 3 Emissions |
| Chapter 4 | Target Setting and Continuous Improvement | Set & report on a science-based target | Stage 5: Striving for Continuous Improvement |
The National Academy of Medicine’s Climate Journey Map will appear throughout the course, ensuring suppliers are aligned to the Climate Journey Map and priorities.
Checking in on your climate progress
Have you completed any of the LOCT for Healthcare Journey goals already?
Select all that apply.
Lesson recap
What Is LOCT for Healthcare
The LOCT for Healthcare program is a free, self-paced training designed to help healthcare suppliers build a strong foundation for measuring, reducing, and reporting greenhouse gas emissions. It provides practical tools and knowledge aligned to the NAM Climate Journey Map: Supplier Pathway.
NAM Climate Journey Stage 1
Stage 1: Understanding and Navigating the Regulatory Landscape
In Stage 1, healthcare suppliers focus on understanding and navigating the complex regulatory landscape governing environmental sustainability. Key activities include identifying applicable federal, state, and international environmental laws, assessing compliance requirements, and engaging with voluntary standard-setting organizations. This foundational stage ensures your organization builds a compliant, credible, and future-ready sustainability strategy.
NAM Climate Journey Stage 2
Stage 2: Governance and Organizational Planning
In Stage 2, organizations translate regulatory awareness into internal action by establishing governance structures and embedding sustainability into organizational planning. This includes making the case to leadership, proposing a carbon emissions governance plan, setting metrics and reporting standards, assessing partnerships, and developing climate response plans that support operational resilience and health equity.
Scope 1 & 2 Footprinting
Introduction to Scope 1 & 2 GHG Footprinting
Watch: What Are Scope 1, 2, and 3 Emissions?
Let's learn about Scope 1, 2, and 3 emissions. Now that we have talked about the basics of greenhouse gas emissions, we want to look at how they play out within your organization.
Emissions are typically reported under Scopes 1, 2, and 3; watch the video for more in-depth information!
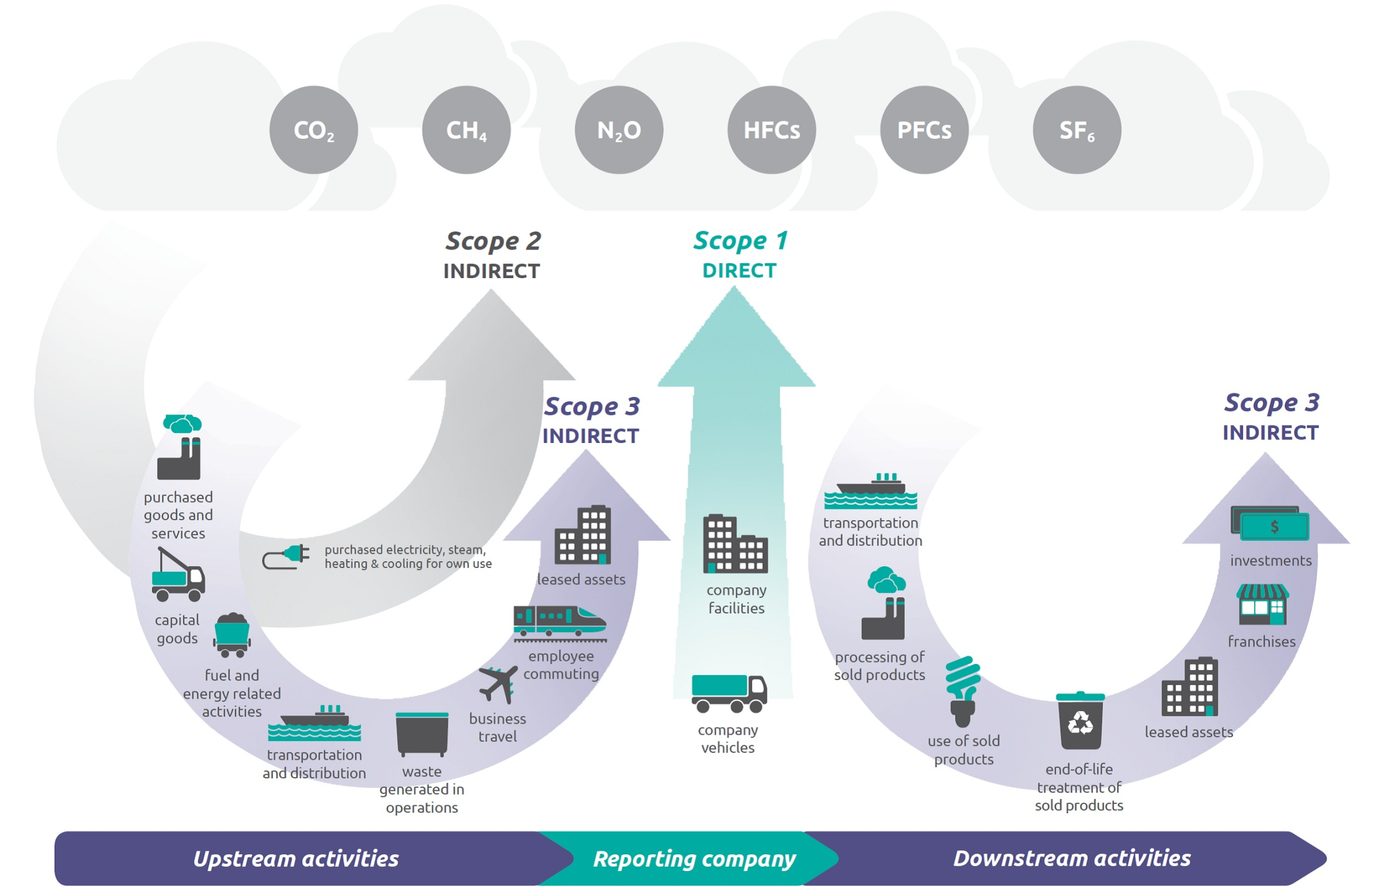
This chapter will focus on Scope 1 and 2 emissions. Use the graphic below for reference on which categories fall into the different scopes.
Read: Setting Organizational Boundaries
What are organizational boundaries? To get started with your GHG inventory, you will need to select and set your organizational boundary. Your organizational boundary determines which emissions are allocated to your Scope 1 & 2 footprint versus someone else's. This step ensures your footprint is relevant and complete while also preventing double-counting.
Emissions within your organizational boundary fall into your Scope 1 & 2 footprint, and emissions outside of your organizational boundary may fall into your Scope 3 footprint.
There are 2 ways to define your organizational boundary: the control approach and the equity share approach. Find out more about which approach you should use by reading below.
The Control Approach
Within the control approach, you take 100% responsibility for all emissions within your company's control. Under the control approach, there are two ways to define what your company has control over: operational control and financial control. Find out more about these below.
Operational Control
Applies if an organization controls the operations of an asset. Using this approach means emissions for all facilities and assets that a company has operational control over are included in the Scope 1 & 2 footprint.
Operational control means that companies have the power to control the operating policies at a facility. For example, this can include deciding when people work there, when the lights are turned on and off, and how the building runs.
This is the most common and recommended approach.
Financial Control
Applies when control is based on financial control, versus legal/operational control.
For most companies, operational control is the same as financial control (which is determined by who gets to control financial decisions and gets economic benefit from the activities that take place at that given site or with that given asset).
This approach accounts for 100% of the GHG emissions over which it has financial control.
Equity Share
Applies when control is divided by percent ownership of an asset.
This is used by companies with complicated ownership structures such as joint ventures. Within the equity share approach, you only take responsibility for the percent of emissions that your company has ownership over. This approach is best suited for companies that have shared facilities or operations.
Checking in on your organizational boundaries
Which approach are you most likely to use to calculate your Scope 1 & 2 emissions (e.g., operational control, financial control, or equity share)?
Write your response below.
Activity: Case Study Organizational Boundaries
Organizational Boundaries for Our Illustrative Companies
Let's bring in our illustrative companies to talk through an example.
| Formula Pharma | Apex Medical Supply & Device Company |
|---|---|
| They own plants in the US and Singapore. In EMEA, they lease and manufacture spaces and have operational control. | They are storing products in a small space in a warehouse where they do not have operational control. |
Whether or not you own or control an asset, your organizational boundary and the resulting emissions will differ depending on the chosen approach. You can see an illustrative example of if Formula Pharma's leased facilities and Apex's storage facility would be included in different organizational boundary approaches below.
| Facility Type | Operational Control | Finance Control | Equity Share |
|---|---|---|---|
| Leased Facilities | Included in your organizational boundary | Likely included if recorded as a capital lease | Likely included if recorded as a capital lease |
| Storage Facility | Only included if company has operational influence | Likely included if company has financial control | Minimal equity share |
Helping set organizational boundaries for Formula Pharma and Apex
Should Formula Pharma's leased facilities be included in Scope 1 & 2?
Select one answer.
Should Apex Medical Supply & Device Co.'s storage facility be included in Scope 1 & 2?
Select one answer.
Activity: Case Study Supply Chain Organizational Boundaries
Checking your knowledge on organizational boundaries in our illustrative company's supply chains
Apex Medical Supply & Device Co. is a medical supplies and devices company. Which step falls under Scope 1 and 2 Emissions for Apex?
Select one answer.
Which steps in Apex Medical Supply & Device Company's Supply Chain would include Tier 1-5 suppliers?
Select all that apply.
Checking your knowledge on organizational boundaries in our illustrative company’s supply chains
Here are activities you may find across Formula Pharma’s supply chain:
Which steps are a part of Scope 3 emissions for Formula Pharma?
Select all that apply, then click Reveal Answer.
Watch: Quantifying Emissions
Footprints Quantify GHGs Generated at Multiple Levels

Company Level During One Year of Operations

Product Level During Product Lifetime

Product Level During a Project Lifetime
The focus of this course will be on a footprint at the company level during one year of operations. We recommend you use your latest calendar or fiscal year.
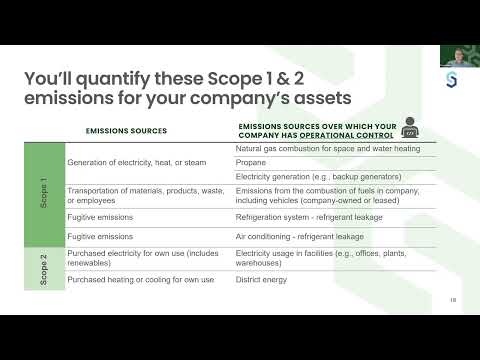
What emissions need to be quantified for Scope 1 & 2? Scope 1 and 2 emissions can come from a variety of sources. Let’s chat more about their specifics…
Read: GHG Protocol Accounting Standards & Principles
Visit the GHG Protocol Website for Standards and Principles
This course follows GHG Accounting Standards!
GHG Protocol Standards & Guidance: https://ghgprotocol.org/standards-guidance
Footprints Must Meet 5 GHG Protocol Principles
| Description | Example | ||
|---|---|---|---|
| 1 | Relevant | GHG inventory must contain all the relevant information that is required for decision making. | A drug manufacturing company with a large amount of refrigeration requirements makes sure to report on all the potential refrigerant emissions. |
| 2 | Complete | GHG inventory must have complete information regarding emission sources and activities within the selected boundary. | The drug manufacturing company includes data for all their facilities around the world. |
| 3 | Consistent | Use consistent methodologies to allow for meaningful comparisons of emissions over time. | The same methodology is used to calculate the emissions for fuel use and electricity year over year. |
| 4 | Transparent | Disclose assumptions clearly, factually and neutrally by maintaining proper documentation. | The data used to calculate the electricity, fuel use, and refrigerant emissions is well-documented. |
| 5 | Accurate | Maintain accuracy and reduce uncertainty while calculating emissions for proper decision making. | The company uses country-specific data for electricity grid emissions to calculate electricity emissions in different parts of the world. |
Checking in on what you have learned thus far
What is another term for "GHG Footprinting"?
Select one answer.
Read: Plan and Prepare for Your Footprint
There are 4 main steps companies take to plan and prepare for their GHG footprints:
- Define your business goals. Consider your company’s reasons for developing a Scope 1 & 2 GHG footprint. Examples include: complying with mandatory sustainability regulations (e.g.: CSRD, CA SBs), responding to customer or investor requests, managing environmental impacts for surrounding communities, and identifying operational efficiencies and cost savings opportunities.
- Determine your footprint team. The teams required to calculate a GHG footprint can vary depending on the size and complexity of your company and its climate maturity. Teams often include (but are not limited to): Procurement or Finance (e.g., activity or spend data on purchases), Technical Operations/Environmental, Health, and Safety, Facilities or Engineering, Research & Development, Clinical Trials, and Leader/executive sponsorship.
-
Set your organizational boundary. Your organizational boundaries determine which emissions are allocated to your Scope 1 & 2 footprint versus someone else’s. This step ensures your footprint is relevant and complete and prevents double-counting. Emissions within your organizational boundary fall into your Scope 1 & 2 footprint; emissions outside of your organizational boundary may fall into your Scope 3 footprint.
For most companies, operational control is the same as financial control (who gets to control financial decisions and gets economic benefit from activities) and is the most common and recommended approach. -
Identify locations and assets within your operational boundary. Ideally, you should include your global operations, but the GHG Protocol allows for regional boundaries. Operational boundaries recognize that emissions are split into three “scopes” based on assets under your control:
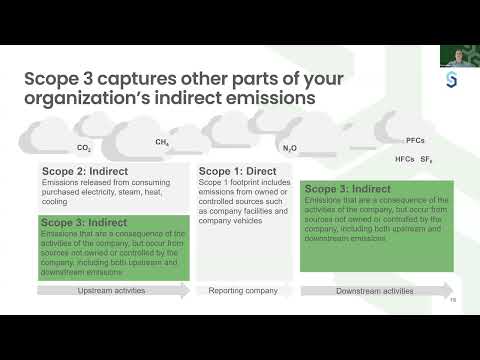
- Scope 1: Direct emissions for assets within your organizational boundary, including burning fuels and refrigerant leakage.
- Scope 2: Emissions resulting from generating electricity, heat, steam, or cooling that is purchased by your company for assets within your organizational boundary.
- Scope 3: Emissions generated from activities outside of your organizational boundaries but that result from your business activities.
Wrap up: Lesson 1.1
Lesson recap
GHG Footprinting Basics
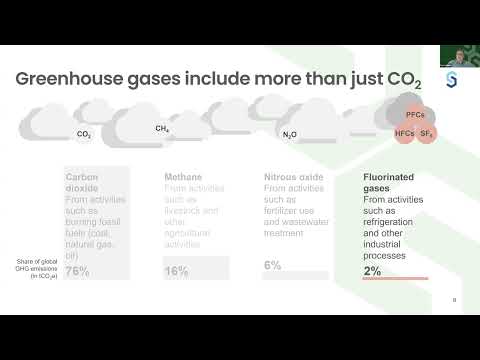
- Greenhouse Effect is the process by which certain gases in Earth's atmosphere trap heat from the sun, keeping the planet warm enough to support life. Greenhouse gases (GHGs) include more than just CO2. They also encompass methane (CH4), nitrous oxide (N2O), and fluorinated gases (HFCs, PFCs, SF6). Carbon dioxide equivalent (CO2e) simplifies the comparisons of the global warming impacts of different gases. CO2e converts amounts of other gases to the equivalent amount of CO2 with the same global-warming potential (GWP). Organizational boundaries can be set using different approaches: operational control, financial control, or equity share. Footprints quantify GHGs generated at the company level during one year of operations, product level during product lifetime, or project level during project lifetime.
Scope 1, 2, and 3 Emissions
- Scope 1 emissions are direct emissions from your organization's activities, such as burning fuels and refrigerant leakage. Scope 2 emissions are indirect emissions from generating electricity, heat, steam, or cooling that is purchased by your organization. Scope 3 emissions are other indirect emissions resulting from your organization's activities but occurring outside your organizational boundaries. However, Chapter 2 focuses on Scope 1 and 2 footprinting. Chapter 3 will cover Scope 3 footprinting.
How to Plan and Prepare to Create Your Footprint
- The steps include
-
- Defining your business goals
- Defining your footprint team
- Setting your organizational boundary
- Identifying locations and compiling your assets within your operational boundary
Data Required to Develop Scope 1 & 2 Footprint
In this lesson, we'll discuss how to define your data collection approach and the concept of your organizational boundary. Additionally, we’ll talk about how to collect data, what data you need, and how to evaluate the quality of that data.

What you will learn
- Get comfortable with collecting data and feel good about the quality of your data!
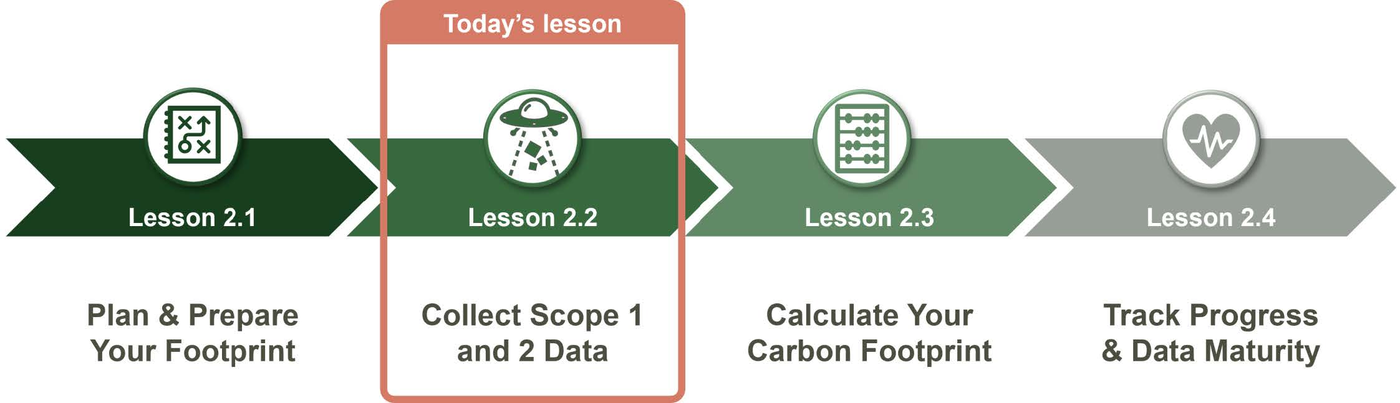
This figure shows the Chapter 2 Overview. Lesson 2.2 focuses on how to collect data for your scope 1 and 2 footprint.
LOOKING AHEAD
In preparation for Lesson 3's assignment, plan to set aside some time to collect data and/or identify team members who can support you in collecting data.
Watch: Calculating Emissions
Watch: How to calculate GHG emissions? The overall goal of this course is to calculate your company's emissions. This is typically done by multiplying activity data with the corresponding emission factor.
Let's take a look at how this formula works.
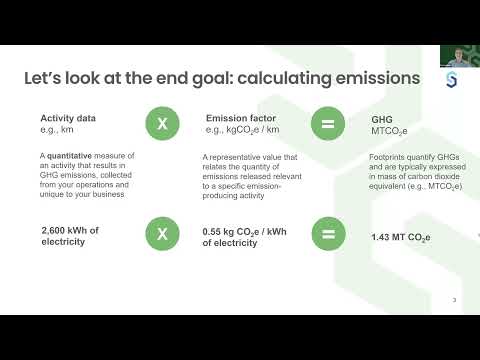
This lesson will focus on how to effectively gather activity data, the first step in calculating emissions. You will learn what data you need, how to collect it, and how to fill in possible data gaps.
Core Formula: Activity Data X Emission Factor = GHG Emissions
Reminder: GHG Protocol Principles
We talked about the 5 GHG Protocol principles in our last lesson. This lesson will dive deeper into how data collection should follow these principles as well.
Data Collection Has to Follow the 5 GHG Protocol Principles
| Description | Example | ||
|---|---|---|---|
| 1 | Relevance | GHG inventory must contain all the relevant information that is required for decision making. | A drug manufacturing company with a large amount of refrigeration requirements makes sure to report on all the potential refrigerant emissions. |
| 2 | Completeness | GHG inventory must have complete information regarding emission sources and activities within the selected boundary. | The drug manufacturing company includes data for all their facilities around the world. |
| 3 | Consistency | Use consistent methodologies to allow for meaningful comparisons of emissions over time. | The same methodology is used to calculate the emissions for fuel use and electricity year over year. |
| 4 | Transparency | Disclose assumptions clearly, factually and neutrally by maintaining proper documentation. | The data used to calculate the electricity, fuel use, and refrigerant emissions is well-documented. |
| 5 | Accuracy | Maintain accuracy and reduce uncertainty while calculating emissions for proper decision making. | The company uses country-specific data for electricity grid emissions to calculate electricity emissions in different parts of the world. |
Collecting Activity Data That Aligns with GHG Protocol Principles
Estimate what percentage of your data is aligned with GHG Protocol principles.
Select one answer, then click Reveal Answer.
There are no incorrect answers — this is a personal self-assessment. Use your answer to guide where to focus your data collection efforts.
Activity: Define Your Organizational Boundary
Which organizational boundary should you use?
Last lesson revealed that organizational boundaries determine which emissions are allocated to your scope 1 &2 footprint versus another company's. Review the organizational boundaries from last lesson here.
Defining your company's organization boundary
Which do you think should be your company's organizational boundary?
Select one answer.
Why do you think the above should be your organizational boundary?
Write your response below.
Read: Materiality Threshold
Analyzing Emissions Using a Materiality Threshold
When calculating greenhouse gas footprints, an important topic to keep in mind is a "materiality threshold." A materiality threshold is used to identify if an error or omission is a material discrepancy. If the error/omission is material, it will trigger a recalculation of the emissions.
The suggested materiality threshold of significance is 5%, as defined by the GHG Protocol. If a calculation error results in a 5% change in emissions, a recalculation of the footprint is required.
However, to build of the "completeness" principle mentioned earlier as a part of the GHG Protocol principle, it is standard practice to not exclude any data from your emissions calculation just because they may be small.
Read: Types of Activity Data
Reminder: Activity data is a quantitative measure of an activity that results in GHG emissions, collected from your operations and unique to your business.
There are two different types of activity data: primary data and secondary data. Read the table below to learn the differences!
Primary Data
Definition
- Data from activities within a company's operations in exact units of measure.
Includes
- Meter readings, purchase records, utility bills, direct monitoring of emissions.
Units
- Typically directly measured quantities (e.g., units of energy, volume, distance) or emissions.
Data Sources
-
- Direct meters
- Procurement databases
- Invoices
- Product labels or specifications
- Fuel records
- Odometers (mileage)
Advantages
- Provides better representation of a company’s specific activities and enables performance tracking and benchmarking.
Disadvantages
- May be difficult and time-consuming to obtain if the data was not historically tracked in internal company systems.
Data Examples
- Scope 1 stationary combustion: Quantities of purchased fuels from utility invoices, procurement data, or internal databases.
- Scope 1 mobile combustion: Quantities of purchased fuels for vehicle fleets, miles traveled in the analyzed period, types of vehicles and their MPG.
Secondary Data
Definition
- Data that is estimated or extrapolated based on other resources or data that requires further calculation before applying an emissions factor.
Includes
- Extrapolation based on internal average data, industry-average data, financial data, and proxy data.
Units
- Typically directly measured cost, square footage, or industry averages of primary data.
Data Sources
-
- Proxies using internal primary data
- Industry reports, national statistics
- Square footage for facilities
- Verified peer carbon footprints
- Environmental Product Declarations
- Financial records
Advantages
- Allows companies to calculate emissions when primary data is unavailable or insufficient. Can be useful for accounting for emissions from minor activities and be more cost-effective and easier to collect.
Disadvantages
- Data may not be representative of a company’s specific activities and may limit ability to track progress toward GHG reduction targets.
Data Examples
- Scope 1 stationary combustion: Estimated consumption per facility type based on partially available data from other facilities under company’s operational control, spend purchasing records, national averages, industry and other research studies.
- Scope 1 mobile combustion: Estimated fuel consumption based on purchasing records, industry peers, national averages, industry and other research studies.
Activity: Determining Types of Activity Data
Helping Apex Medical Supply & Device Company determine what kind of data they are using
Apex Medical Supply & Device Company is collecting their Scope 1 & 2 GHG footprinting data and found utility invoices which measures their exact electricity usage each month in kilowatt hours.Is this an example of primary or secondary activity data?
Select one answer.
Activity: Methods to Collecting Your Data
Let's Learn How to Collect Data
Now that we know the difference between primary and secondary data, let's learn how to collect the best data possible.
It is important to always try to collect the most accurate data possible.
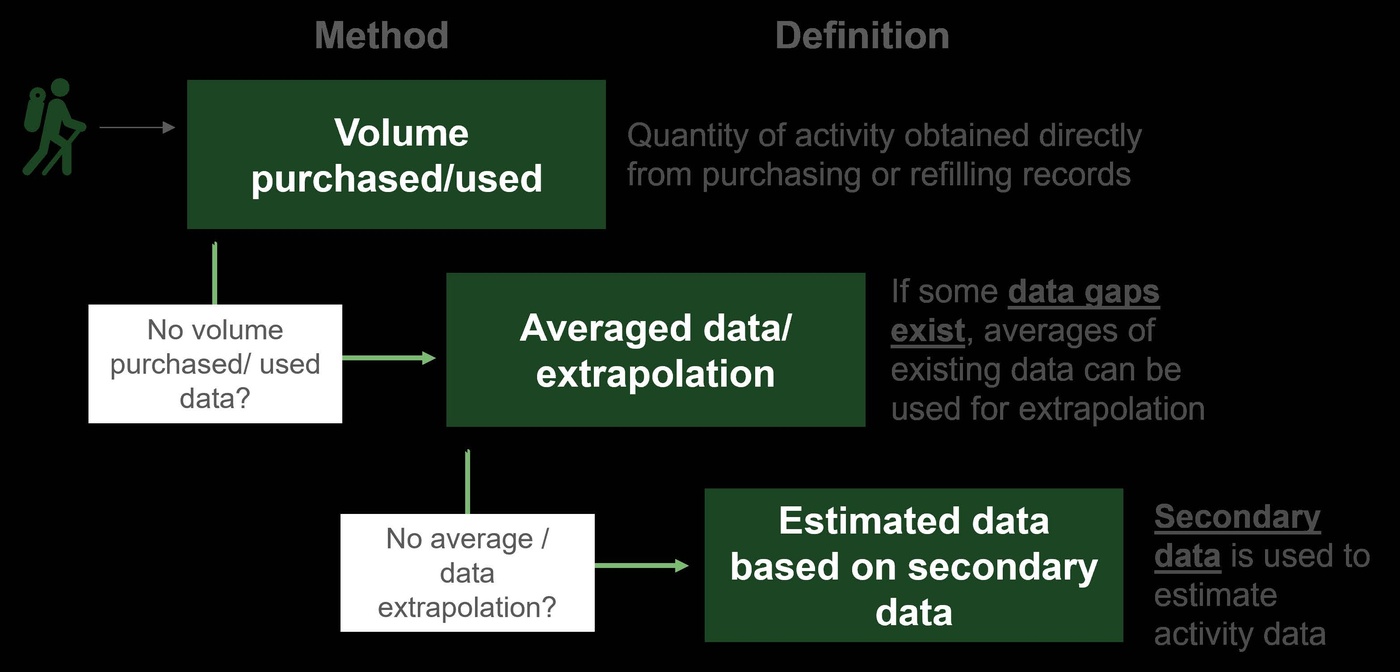
Connecting data collection methodologies to primary & secondary data
Now that you know the data collection methods and primary vs. secondary data, select which data collection methods would result in collection of primary data?
Select all that apply.
Watch: Additional Data Collection
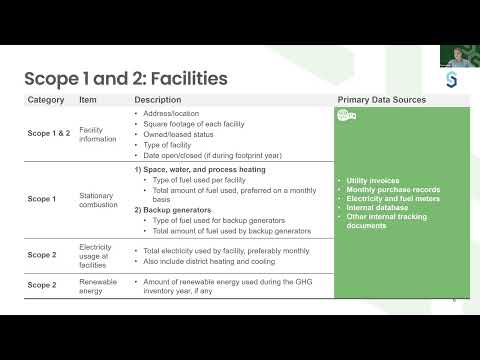
Collecting Additional Detailed Data
Once you've created your facility list, it is important to add additional details about each facility, as well as your other assets. Learn how to do this by watching the video below.
Read: Data Collection Continuous Improvement
Stages of Data Collection
Data collection is an activity that requires continuous improvement and has different maturity levels. Your activity data can come in a variety of formats and file types. Most people who are just beginning a footprint will be at the 'starter' stage, as detailed below, and the goal is to work up to the 'best-in-class' stage to have the most accurate footprint possible.
Starters
- Beginning in the starter stage means that you will receive a wide variety of data inputs, types, and formats from your various internal and external stakeholders.
- Being in this starter stage typically entails using Excel-based tools to calculate your emissions. Many starters will manage data in various formats (e.g., tables, models, descriptions, files) and from various sources (e.g., invoices, emails, Excel files).
- We recommend that you have conversations with your stakeholders before asking for data to make sure everyone is aligned and to streamline the process as much as possible.
- Overall, this will be an iterative approach, as you will likely need to reach back out to stakeholders for follow-up questions, missing data, or additional data.
- Thus, with your footprinting team, you will need to stay organized and work on harmonizing the various inputs.
- On the plus side, being a starter allows for more flexibility and is less rigid, and you may be able to get data faster from your stakeholders as a result.
- Advantages include
- Flexibility for data providers
- Data is often available without much preparation
- Disadvantages include
- Harmonizing and data quality checks remain with GHG footprint team
Routine & Well-prepared
- Being in the routine and well-prepared data collection stage, which can come further down the road, means that you have a harmonized data collection process. This usually entails having a template that you send out to your stakeholders, and that this template is in one, simple to understand, and simple to fill out, format.
- A prerequisite for developing these templates is that you need to know what you can expect from data owners, which requires those conversations with your identified data owners from the first assignment.
- Once you have an idea of the data you will be receiving, you can set up your template using the specific data types and activities your company tracks. This template can then be sent out to those you will be collecting the data from, with specific columns for them to enter their activity data.
- Advantages include
- Data is received in the required format
- Easier to check for quality and completeness
- Disadvantages include
- Less flexibility on data input side
- Still individual data files
Best in Class
- The best-in-class stage would entail the use of a sophisticated GHG tracking software, which you can find a variety of in the market today. You may run this as a stand-alone dedicated GHG system or integrate it with your existing risk management systems.
As part of this course and to assist you with the activity data collection, we will provide you with a template you can use to complete your first Scope 1 & 2 GHG inventory.
This template has different sections where you will collect and enter your data, including sections for facilities, vehicles, and refrigerants.
It is important to note that the sections in the template are just suggestions. Your GHG footprint will be unique to your organization, and you can change the columns as needed to meet your specific needs.
Watch: Evaluate Data Quality
Data Quality Mechanisms
High data quality in GHG footprinting ensures that your emissions calculations are accurate, complete, and reliable. Follow the steps below to ensure your company is providing quality data for your footprint.
Data Quality Dimensions: Purpose and Accuracy
Watch the video below to learn about the importance of purpose and accuracy for data quality.
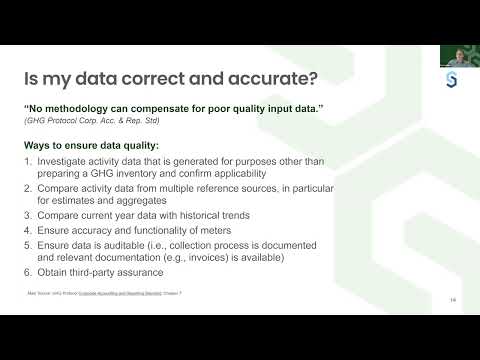
For more information review Chapter 7 of the GHG Protocol Corporate Accounting and Reporting Standards.
Activity: How to Ensure Data Quality
Brainstorming ways to ensure data quality
What are some ways to ensure data quality?
Select one answer.
Wrap up: Lesson 2.2
Lesson recap
Defining Your Data Collection Approach
- In this lesson, we were reminded of the GHG Protocol principles, learned about the materiality threshold, covered setting an organizational boundary, and discussed identifying facility locations and compiling assets. All of these are critical steps to complete before you start footprinting!
Collecting Your Activity Data
- Next, we discussed the difference between primary and secondary data and the different methods to collect each of these types of data. We noted that primary data is the goal, but your data collection approach and the data your receive is likely to improve over time as you continue to practice data collection steps.
Evaluating Data Quality
- You learned the importance of purpose and accuracy during your data collection and how to apply this to your Scope 1 & 2 footprint data collection.
How to Calculate Your Scope 1 & 2 Footprint
This lesson will provide an overview of how to calculate your greenhouse gas footprint and then take a deep dive into how to fill any gaps in data that you may have. It will also teach you how to assess uncertainty and sensitivity to develop the most accurate footprint.

What you will learn
- Understand how to calculate your GHG footprint
- Learn about data quality levels
- Be ready to fill any data gaps you might have
- Be able to assess uncertainty and sensitivity of data
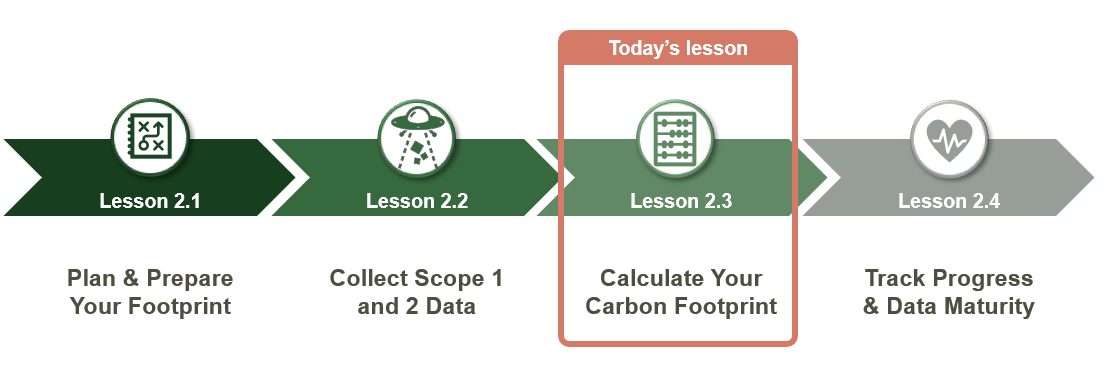
This figure shows the Chapter 2 Overview. Lesson 2.3 focuses on how to calculate your scope 1 & 2 carbon footprint.
Read: Calculating Your GHG Footprint
The end goal of this course is for you to be able to calculate your company's Scope 1 & 2 emissions. Typically, these emissions are calculated by multiplying activity data with the corresponding emission factor.
GHG Footprint Formula Example
Remember the formula below from the last lesson? Need a refresher? Click back to Lesson 2.2 to revisit how to calculate GHG emissions.
For this lesson, we are going to focus on how to effectively apply an emissions factor to calculate your GHG emissions!
Read: Emission Factor Characteristics
You will choose emission factors based on associated characteristics
There are many different emission factor sources and databases, therefore, you will need to look at your activity data and choose the emission factors who's characteristics match that activity data best.
There Are Four Categories of Emission Factor Characteristics that Will Help You Choose:
Geography
Emission factors can be specific to a city, country or region, or globally applicable.
Technology / Product
Emission factors will differ based on the specifics of the underlying activity.
Year
Many databases recalculate emission factors to incorporate updated methodologies or data on an annual basis.
Scope
Emission factors can differ in the parts of an activity or product life cycle that they represent.
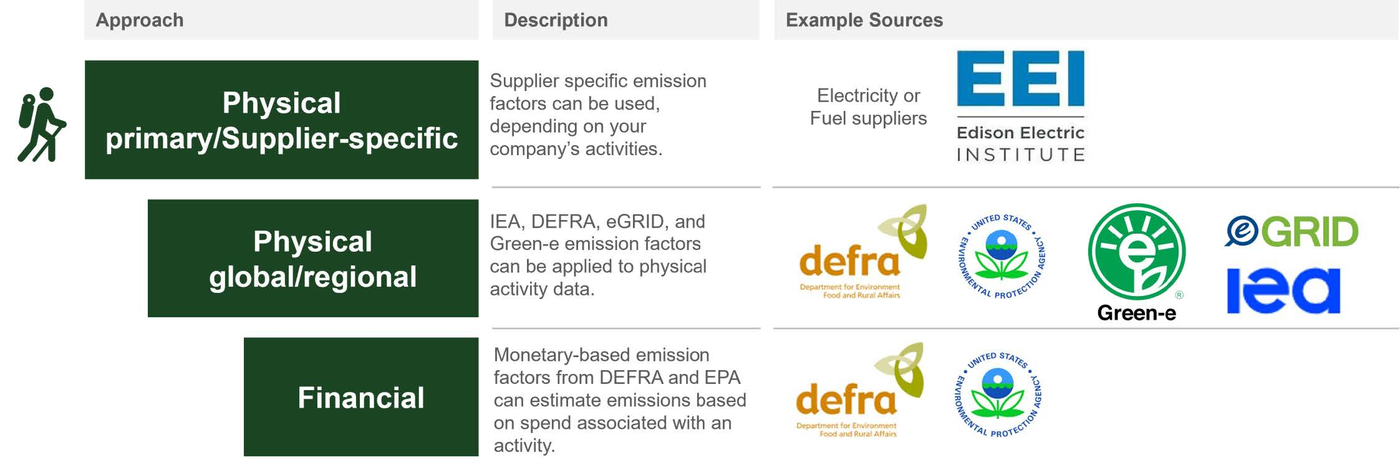
It Is Important to Use the Most Accurate Emission Factors Possible
As illustrated in the diagram below, the accuracy of emissions data improves progressively from financial to physical supplier-specific approaches. As your organization advances in data collection maturity, you will be better positioned to apply more precise, activity-specific emission factors. Furthermore, the availability and use of refined emission factors are expected to grow over time as scientific methodologies evolve and more industry- and process-specific data become accessible.
Reference: Emission Factor Sources
Scope 1 Emission Factor Sources
Stationary Fuel Combustion
| Region | World |
|---|---|
| Emission Factor Name/Tab | Fuels; Bioenergy |
| General Comment | No time lag; Sum of CO2, CH4, and NO2 |
| Region | USA |
|---|---|
| Emission Factor Name/Tab | Stationary Combustion (Table 1) |
| General Comment | Convert CH4 and N2O to CO2e and sum up with CO2 |
| Region | Australia |
|---|---|
| Emission Factor Name/Tab | Table 9 |
| General Comment | — |
Mobile Fuel Combustion
| Region | World |
|---|---|
| Emission Factor Name/Tab | Passenger vehicles; Delivery vehicles |
| General Comment | No time lag; Sum of CO2, CH4, and NO2 |
| Region | USA |
|---|---|
| Emission Factor Name/Tab | Stationary Combustion (Table 1) |
| General Comment | Convert CH4 and N2O to CO2e and sum up with CO2 |
| Region | Australia |
|---|---|
| Emission Factor Name/Tab | Table 1 Indirect emission factors from consumption of purchased or acquired electricity |
| General Comment | Convert unit from kgCO2e/kWh to kgCO2e/GJ if needed |
Fugitive Emissions (Refrigerants)
| Region | World |
|---|---|
| Emission Factor Name/Tab | — |
| General Comment | GWP from 2nd, 4th and 5th IPCC Assessment Reports |
| Region | USA |
|---|---|
| Emission Factor Name/Tab | Global Warming Potentials (Table 11) |
| General Comment | — |
Scope 2 Emission Factors
Electricity: Location-based
| Region | USA |
|---|---|
| Emission Factor Name/Tab | Total output emission rates — CO2e (Table 1) |
| General Comment | One-year lag; Convert unit from lbCO2e/MWh to kgCO2e/kWh if needed |
| Region | UK |
|---|---|
| Emission Factor Name/Tab | UK electricity |
| General Comment | No time lag; Sum of CO2, CH4, and NO2 |
| Region | Other countries |
|---|---|
| Emission Factor Name/Tab | Summary — Product: Total — Flow: Emissions per kWh of electricity only |
| General Comment | Requires two-year lag; Sum of CO2, CH4, NO2; Convert unit from gCO2/kWh to kgCO2/kWh |
| Region | Australia |
|---|---|
| Emission Factor Name/Tab | Table 1 — Indirect emission factors from consumption of purchased or acquired electricity |
| General Comment | Convert unit from kgCO2e/kWh to kgCO2e/GJ if needed |
PRC Electricity Emission Factors
| Region | China |
|---|---|
| Emission Factor Name/Tab | — |
| General Comment | — |
Electricity: Market-based
Green-e Residual Mix Emission Rates
| Region | USA (by region) |
|---|---|
| Emission Factor Name/Tab | Adjusted System Mix |
| General Comment | One-year lag; Convert unit from lbCO2/MWh to kgCO2/kWh if needed |
EEI (Edison Electric Institute)
| Region | USA (by utility) |
|---|---|
| Emission Factor Name/Tab | Utility Specific Residual Mix Emissions Rate |
| General Comment | Two-year lag; Convert unit from lbCO2/MWh to kgCO2/kWh if needed |
| Region | Europe |
|---|---|
| Emission Factor Name/Tab | CO2 or Direct CO2 (Table 2) |
| General Comment | One-year lag; Convert unit from gCO2/kWh to kgCO2/kWh |
| Region | Other Countries |
|---|---|
| Emission Factor Name/Tab | See location-based |
| General Comment | See location-based; Residual mix EF databases for countries outside EU/US do not exist — use location-based IEA factor. |
| Region | Australia |
|---|---|
| Emission Factor Name/Tab | Indirect EFs from consumption of purchased or acquired electricity: market-based (Table 2) |
| General Comment | Convert unit from kgCO2e/kWh to kgCO2e/GJ if needed |
Electricity: Market-based Renewable
| Region | World |
|---|---|
| Emission Factor Name/Tab | — |
| General Comment | For market-based accounting, the emission factor used for the renewable electricity consumed is zero |
Heat & Steam
| Region | World |
|---|---|
| Emission Factor Name/Tab | Heat and steam |
| General Comment | No time lag; Sum of CO2, CH4, and NO2 |
| Region | USA |
|---|---|
| Emission Factor Name/Tab | Steam and Heat (Table 7) |
| General Comment | Convert CH4 and N2O to CO2e and sum up with CO2 |
Cooling
| Region | World |
|---|---|
| Emission Factor Name/Tab | — |
| General Comment | Cooling is usually electricity driven (see Electricity section) and/or linked to refrigerant leakage (see Fugitive emissions section) |
Watch: Scope 2: Location & Market-based Accounting
There Are Two Different Ways to Estimate Scope 2 Electricity Emissions
The GHG Protocol suggests that you report on both methods. The video below will walk you through each method, their emission factors, purpose, and if you should be reporting them.
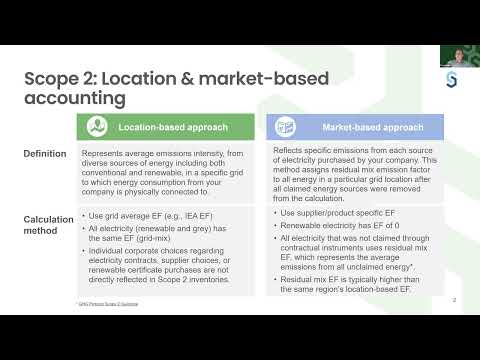
Summary of Location & Market-based Accounting
Location-based Approach
| Definition | This approach calculates GHG emissions based on the average emissions intensity of the local grid where the electricity consumption occurs |
|---|---|
| Emission Factors | Grid-average emissions factors |
| Purpose | This method reflects the physical reality of where the electricity is consumed and the associated emissions from the local grid |
| Should You Be Reporting? | Yes |
Market-based Approach
| Definition | This approach calculates GHG emissions based on the specific emissions factors associated with the electricity purchased by the company, which can include energy attribute certificates (EACs) or supplier-specific emissions factors |
|---|---|
| Emission Factors | Supplier-specific emissions factors or contractual instruments like EACs |
| Purpose | This method reflects the choices a company makes in purchasing electricity and supports corporate claims about the use of renewable electricity |
| Should You Be Reporting? | Yes |
Watch: Data Quality Levels
Global Warming Potentials (GWP): IPCC Emission factors are often listed with 3 components: carbon dioxide (CO2), methane (CH4), and nitrous dioxide (N2O). You will have to multiply each by its associated global warming potential (or GWP) from the IPCC and then add all of those values up in order to get to the CO2e unit needed for emissions calculations.
* If an emissions factor is already in CO2e, then you don't need to do any conversions.
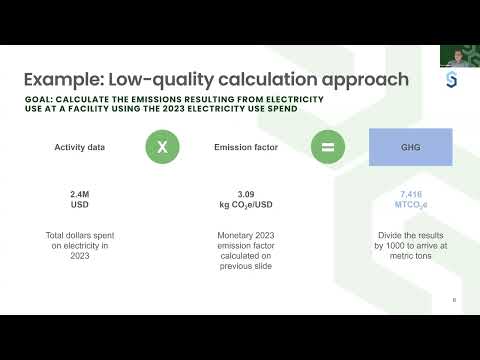
Watch: Data Quality Calculation Examples
Read: Filling Data Gaps
Scope 1 & 2 Data Gaps and Their Recommended Methodologies
The majority of the time, you will find that you are missing some of the data necessary to complete all of your calculations. This is normal and almost all companies experience this. Overtime, it should be your goal to improve your data collection to avoid having any data gaps.
In the Meantime, You Can Use the Methods Below to Fill in Your Missing Data:
Average based on historic data
This involves calculating the average of the data you already have and applying it as a proxy for the missing portion. For example, if data for May is missing, you can average the values from the other months to estimate May’s data.
Extrapolation based on existing data
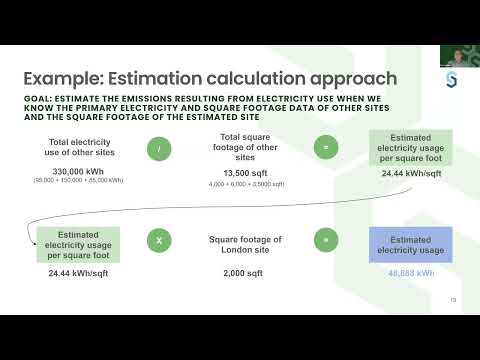
Another method is extrapolation, which is particularly useful when data is missing for entire sites or facilities. In this case, you can correlate emissions with known variables such as square footage or number of employees. For instance, if you have data for several facilities but one is missing, you can calculate the average emissions per square foot or per employee from the available data and apply that ratio to the missing facility based on its size or staffing.
Proxies and estimates
If neither averaging nor extrapolation is feasible, proxy data from external sources can be used. This involves referencing expert judgment or industry benchmarks to estimate emissions. For example, the Commercial Buildings Energy Consumption Survey (CBECS) provides average energy usage by building type, size, and number of employees. Similarly, the U.S. Environmental Protection Agency (EPA) offers proxy data for refrigerant use in various applications, including residential air conditioning and commercial refrigeration systems. Additional guidance on using CBECS and EPA data can be found in the appendix.
Watch: Gap-filling Calculation Examples
Activity: Assessing Uncertainty and Sensitivity
How You Can Understand and Manage Uncertainties
GHG inventories inherently involve uncertainties due to incomplete data, assumptions, and the complexity of emission processes. Uncertainties can be categorized into two types: scientific or estimation uncertainty. Understanding and managing these uncertainties improves GHG inventory accuracy and aligns with the GHG Protocol standards.
How to Tackle Uncertainty
Scientific Uncertainty
- Limited options for action
- Scientific knowledge of emissions is evolving continuously
- Ensure use of up-to-date emission factors and global warming potential (GWP) values
Model Uncertainty
- Limited options for action
- Revisit your calculation model regularly: have it externally verified
- Double-check applicability of your model when making changes to the types of inputs such as moving from estimates to measured data
Statistical Uncertainty
- Limited options for action
- Revisit your calculation model regularly: have it externally verified
- Double-check applicability of your model when making changes to the types of inputs such as moving from estimates to measured data
Systematic Uncertainty
- Estimate statistical uncertainty
- Repeat experiments or sampling of data to detect random uncertainty
- Collect expert judgements on uncertainty
- Conduct scenario analysis
GHG Protocol Resources — Uncertainty & Data Quality
- GHG Protocol Corporate Standard — Chapter 7: Section on uncertainty assessments and data quality management plan
- GHG Protocol Uncertainty Tool: Tool to assess individual uncertainty per emissions source. Although designed for Scope 3, its logic can be applied for Scope 1 & 2 as well.
- GHG Protocol Uncertainty Calculation Guidance: Helpful document with background information around uncertainty calculations
Wrap up: Lesson 2.3
Lesson recap
How to Calculate Your GHG Footprint
- GHG emissions are calculated by multiplying activity data with the corresponding emission factor. Emission factors need to be chosen based on geography, technology/product, year, and scope. It is also important to use the most accurate emission factors possible.
Scope 2: Location & Market-based Accounting
- Location-based accounting calculates GHG emissions based on the average emissions intensity of the local grid where the electricity consumption occurs. Market-based accounting calculates GHG emissions based on the specific emissions factors associated with the electricity purchased by the company, which can include energy attribute certificates (EACs) or supplier-specific emissions factors.
Data Quality Level Calculation Examples
- This section of the lesson provided calculation examples for different qualities of data.
Processes to Fill Data Gaps
There are three recommended methodologies to fill Scope 1 & 2 data gaps:
- Average based on historical data
- Extrapolation based on existing data
- Proxies and estimates
How to Assess Uncertainty and Sensitivity
Uncertainties can be categorized in two types:
- Scientific uncertainty arises when the science behind the actual emissions calculation is not completely understood. For example, this could come from struggling with incomplete knowledge of the science behind the direct and indirect factors associated with the global warming potential values.
-
Estimation uncertainty arises any time GHG emissions are quantified. In other words, according to the GHG Protocol, all emissions estimates are associated with some level of estimation uncertainty. Estimation uncertainty can be further classified into two types: model and parameter uncertainty.
- Model uncertainty refers to the uncertainty associated with the mathematical equations or models used to calculate your emissions. For example, model uncertainty may arise either due to the use of an incorrect mathematical model or inappropriate input into the model.
- Parameter uncertainty refers to the uncertainty associated with quantifying the parameters used as inputs, or the activity data and emission factors, into estimation models due to either statistical or systemic issues.
GHG Footprint Case Study
This lesson will cover how to track progress in your carbon footprint as well as advancing towards data maturity.

What you will learn
- Have a wholistic understanding of a GHG footprint by walking through a case study
- Understand how to gap fill for missing data in your footprint
- Learn how to get the most accurate and precise information to reach data maturity and have the best possible GHG footprint
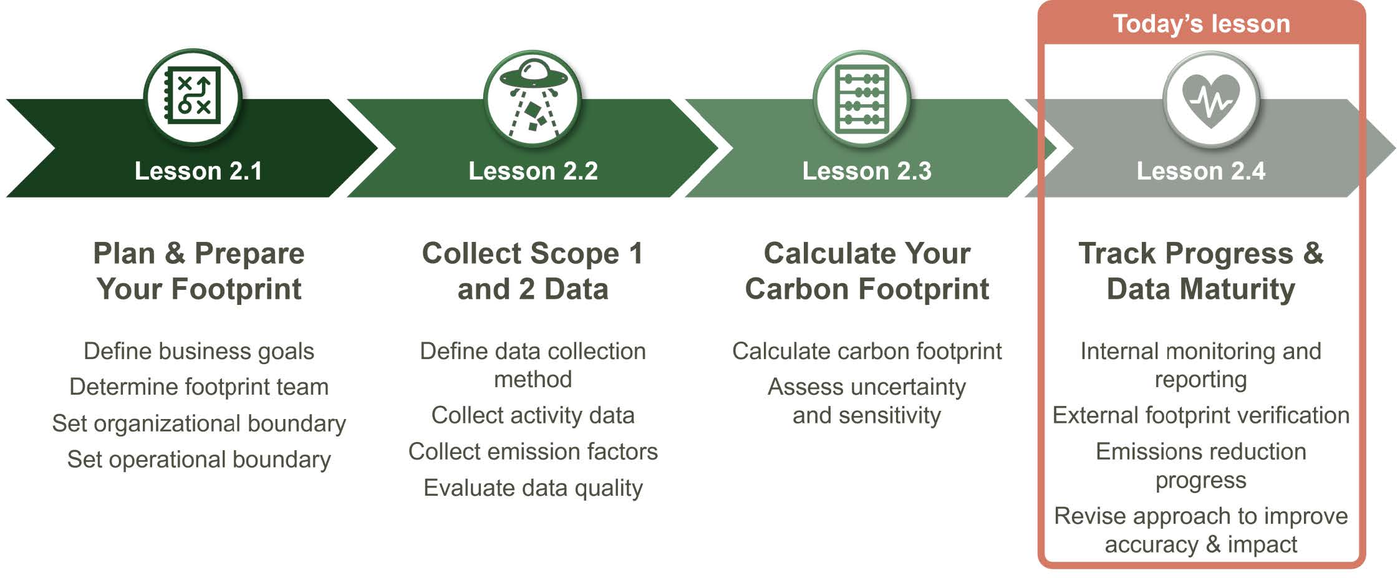
This figure shows the Chapter 2 Overview. Lesson 2.4 focuses on how to track progress and reach data maturity.
Activity: GHG Footprint Case Study
Let's Begin the Case Study by Reviewing Our Illustrative Companies
| Formula Pharma | Apex Medical Supply & Device Company |
|---|---|
| Formula Pharma has grown into a multi-national corporation with headquarters in the US and manufacturing facilities in the US, Canada, Brazil, Switzerland and France As part of their sustainability journey and efforts to align with sustainability regulations and best practices, they want to set science-based targets. | Apex Medical Supply & Device Company is a multi-national organization that has operations throughout the US, UK, Italy, Spain, Singapore, and Australia Apex's major customers are asking them to set science-based targets. |
Imagine you are the new Sustainability Manager at either of these companies. One of your first tasks is to develop a Scope 1 & 2 footprint in alignment with the GHG protocol standards. Keep in mind, this footprint will be used to set the company's targets. The next few pages will walk you through the steps needed to develop a footprint for these companies.
Preparing for Formula Pharma 's and Apex Medical Co.'s footprint
What must each company identify before beginning to collect data for their footprints?
Select one answer.
Watch: Starting Your Footprint
Determining Your Footprinting Boundaries & Collecting Data
This video will walk you through the footprint boundaries Formula Pharma's and Apex's Sustainability Managers need to consider.

Now that you have determined the organizational boundaries and started considering the data collection, let's think about how you would approach this as a Sustainability Manager for Formula Pharma and Apex.
| Formula Pharma | Apex Medical Supply & Device Company |
|---|---|
| Formula Pharma owns all its US-based manufacturing facilities as well as two facilities in Switzerland. The manufacturing facilities in Canada and Brazil are leased under a long-term lease and Formula Pharma maintains its operational control over these facilities. The facilities in France are also leased, but Formula Pharma does not have operational control over these facilities. | Apex Medical Supply & Device Company owns all their facilities in North America, Australia and Singapore. Their UK product manufacturing facilities are leased and Apex has operational control over these facilities. The facilities in Italy and Spain are also leased, but Apex does not have operational control over these facilities. |
Practice: Footprinting boundaries
The manufacturing facilities are leased under a long-term lease and formula pharma as well as apex medical supply & device company maintain operational control over these facilities. Should Formula Pharma and Apex include these facilities in their Scope 1 and 2 footprints?
Select one answer.
The facilities in France, Italy and Spain are also leased, but formula pharma and apex medical supply & device company do not have operational control over these facilities. Should Formula Pharma and include these facilities in their Scope 1 & 2 Footprint?
Select one answer.
Formula pharma has a facility in Austin, Texas, which opened in March 2010 and closed in May 2024. Should Formula Pharma include the facility in their Scope 1 and 2 Footprint?
Select one answer.
Read: How to Gap Fill for Missing Facility Data
Looking at Your Available Data
Now that you set your boundaries, let's take a look at Formula Pharma's facility list to see what data points are available they were able to collect.
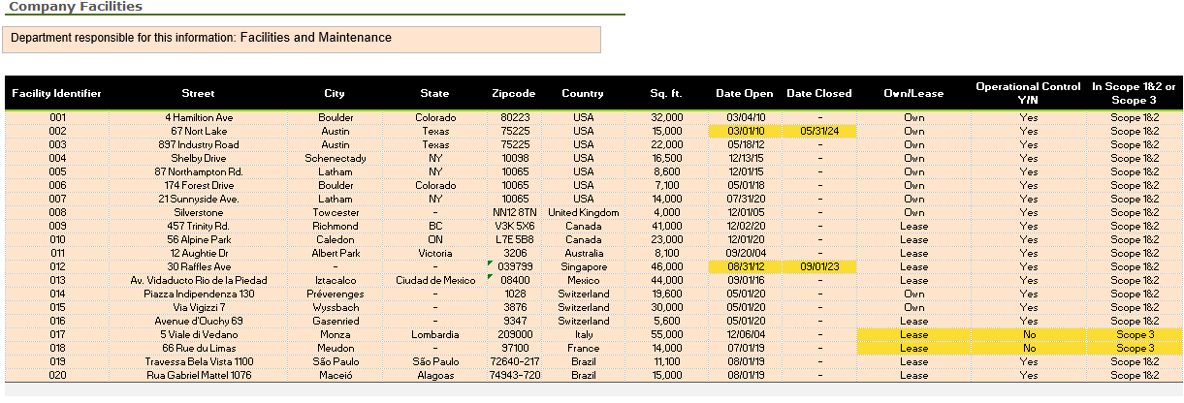
Their next step is to start collecting the energy usage at each of these facilities..
Activity: What happens if there is missing data?
Let's say Formula Pharma starts working to find energy usage at its facilities and discover they can't find..
Any Electricity Usage Data for Three of Its Facilities in:
- Latham, NY
- Richmond, BC
- Victoria, Australia
Three Months of Any Energy Usage Data in Three of Its Facilities in:
- New York State
- United Kingdom
- Switzerland
Gap filling for electricity data
How do you think Formula Pharma should fill in the data gaps for its facilities?
Select one answer.
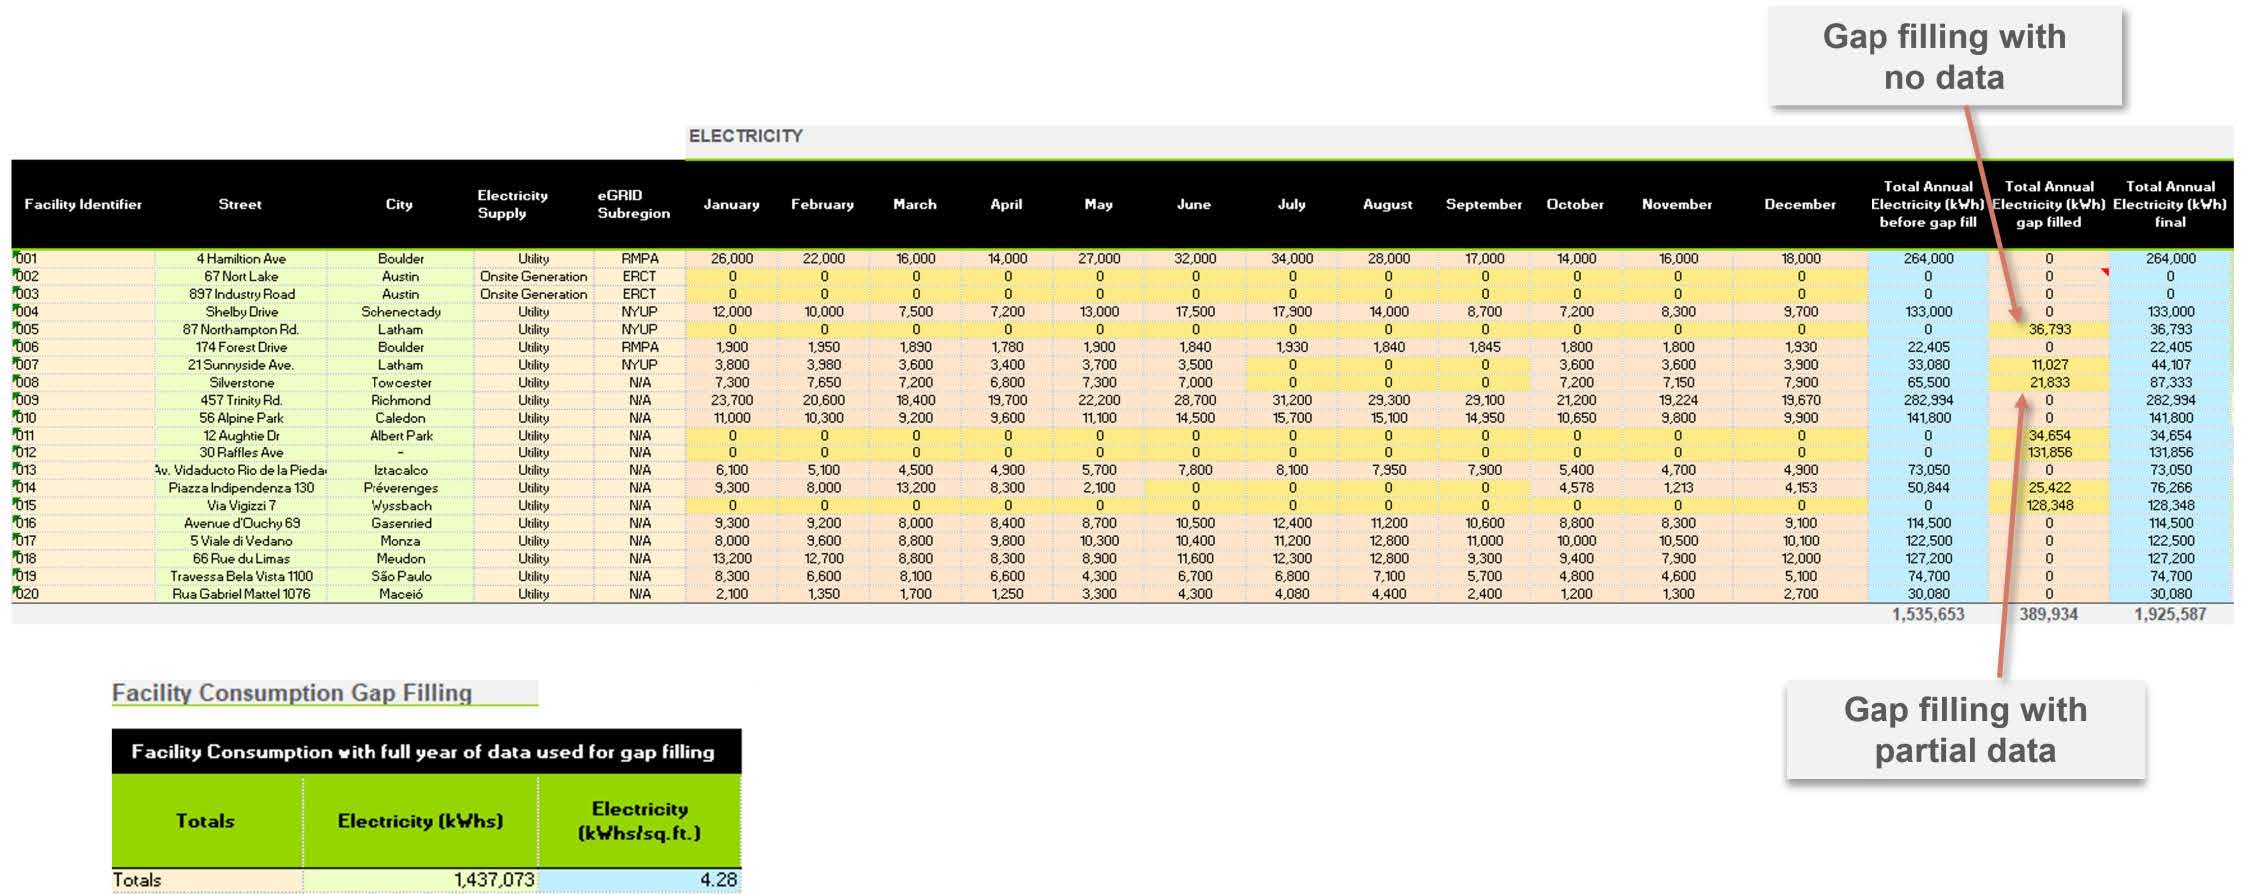
Filling in Missing Electricity Data
Before correcting for the missing data, first ensure that you have decided and agreed upon where the data gaps exist.
It is very important to apply the appropriate gap filling methodology.
We can apply two different approaches for gap filling.
Approach Without Any Data Available for a Facility
- Calculate the average kWh per sq. ft. from the facilities with known data and apply to the facilities with no data.
Approach with Partial Data Available for a Facility
- Where only some of the months are missing data, gap fill using the data for the months known for this facility and calculate average/month.
Example: Applying Gap Filling Approaches
In the table below, you will find both approaches at gap filling applied. Notice how the approach differs based on if month to month data is available (partial) versus if no month to month electricity data is available (no data).
Read: Emission Factor Sources for Electricity Usage
Determine Your Emission Factors
Now that you have identified your facilities and energy usage data, it's time to decide which emission factors to apply to each facility location! To calculate the emissions associated from the electricity usage from each of the facilities, we need to apply emission factors.
Location plays an important role in emissions because different regions have different electricity grids and energy mixes, which means the emissions can vary significantly for each location, even if the energy usage is the same.
Formula Pharma Includes Facilities from the Following Regions in Their Footprint:
United States
Suggested Emission Factor Source: EPA Emission factors for location-based method and Green-e for market-based method (North America)
Canada
Suggested Emission Factor Source: Use Canada's National Inventory Report; market-based emission factors are not provided.
Australia
Suggested Emission Factor Source: Use Australia's National GHG emissions report.
United Kingdom
Suggested Emission Factor Source: Use IEA emissions factors for location-based, but this is a paid database, it is possible to use DEFRA emission factors as proxy. Market-based emission factors are available for Europe from AIB and DEFRA (Europe)
Germany
Suggested Emission Factor Source: Use IEA emissions factors for location-based, but this is a paid database, it is possible to use DEFRA emission factors as proxy. Market-based emission factors are available for Europe from AIB and DEFRA (Europe)
Switzerland
Suggested Emission Factor Source: Use IEA emissions factors for location-based, but this is a paid database, it is possible to use DEFRA emission factors as proxy. Market-based emission factors are available for Europe from AIB and DEFRA (Europe)
Italy
Suggested Emission Factor Source: Use IEA emissions factors for location-based, but this is a paid database, it is possible to use DEFRA emission factors as proxy. Market-based emission factors are available for Europe from AIB and DEFRA (Europe)
France
Suggested Emission Factor Source: Use IEA emissions factors for location-based, but this is a paid database, it is possible to use DEFRA emission factors as proxy. Market-based emission factors are available for Europe from AIB and DEFRA (Europe)
Singapore
Suggested Emission Factor Source: Use Singapore's National GHG emissions report.
Japan
Suggested Emission Factor Source: Use Japan's National GHG emissions report.
Example: Let's see how Formula Pharma applies their location-specific emission factors to each of their facility locations.
Watch: Calculating Natural Gas Emissions
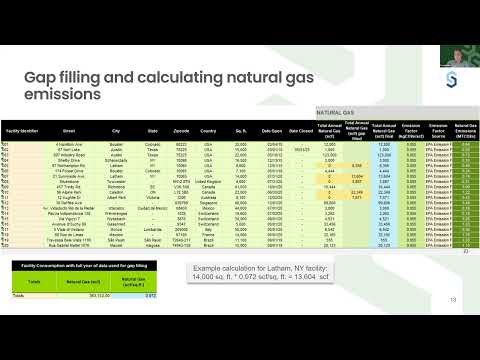
Formula Pharma Calculates Its Natural Gas Emissions
Natural gas is one of the most common Scope 1 emission sources for healthcare suppliers. Watch the following video to see how Formula Pharma calculates its natural gas emissions using activity data and the appropriate emission factors.
Watch: Incorporating Renewable Energy Generation into Footprints
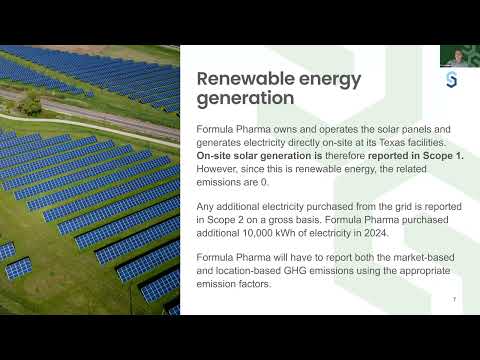
Let's See How Formula Pharma Incorporates Solar into Their Footprint
Formula Pharma’s management is very much interested in doing the right thing for the environment and as a result, a few years ago, they decided to install solar panels on two of their US-based facilities in Texas.
Watch the following video below to discuss how Formula Pharma incorporates solar energy generation into their footprint.
Activity: GHG Emissions for Fleet

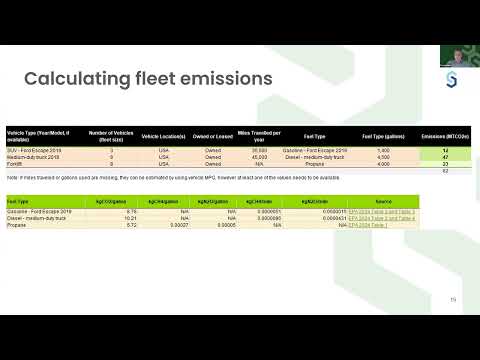
Formula Pharma also owns a very small fleet of trucks and forklifts located in the United States. These vehicles move Formula Pharma’s products in its manufacturing facilities and transport them from its facilities to distribution centers owned and controlled by third parties.
Formula Pharma Has the Following Fleet:
- 3 SUV Ford Escape 2019 (gasoline)
- 6 Medium-duty trucks model year 2018 (diesel)
- 8 Forklifts (propane)
Formula Pharma’s products are manufactured in Canada and Switzerland are transported using third- party logistics companies.
Fleet ownership
Formula Pharma's products that are manufactured in Canada and Switzerland are transported using a third-party logistics company. Would you put the GHG emissions in Scope 1, 2, or 3?
Select one answer.
Watch: Calculating Fleet Emissions
Formula Pharma Has All of Their Fleet Information, so Let's Calculate It
Watch the video for a step-by-step process of calculating Formula Pharma's fleet emissions.
Activity: Calculate Refrigerant Emissions
Calculating Refrigerant Emissions
Because Formula Pharma uses refrigeration for its drug products it keeps inventory of refrigerants for 3 of its locations. It has records about three different refrigerants that were refilled in 2024: R-410A, R- 407C, and R-402B.
Emissions related to refrigerant leakage can be calculated based on the refill amounts.
For the rest of the locations, Formula Pharma does not have records in place about refrigerants used and therefore we decided to gap fill the refrigerants using “Accounting Tool to Support Federal Reporting of Hydrofluorocarbon Emissions” as a resource.
Refrigerant leakage data requirements
Let’s do some refrigerant calculations!
If you have primary data, what data do you need to calculate the emissions from refrigerant leakage?
Select all that apply.
Refrigerant Leakage Calculations
Now that you know what information you need… let’s do a practice calculation!
What is the formula needed to calculate the emissions (in MT CO2e) from refrigerant leakage?
Write your response below.
Formula: Amount of Refrigerant Leaked (kg) × (1 kg ÷ 1,000 kg per MT) × Refrigerant GWP = MT CO2e
What are the emissions (in MT CO2e) from refrigerant leakage for Facility #002?
Write your answer below, then click Reveal Answer.
Correct answer: 11.37 MT CO2e. Make sure you converted the amount of refrigerant into MT CO2e before multiplying by the GWP value.
Wrap up: Lesson 2.4
Lesson recap
Data Collection Methods and Procedures
- In this lesson, we discussed how to go about collecting better and better data for a mature and accurate footprint.
How to Gap Fill for Missing Data
- Next, we discussed how to account for data that you might not be able to collect in your footprint directly. There are many cases in carbon accounting where we are missing pieces of data and need to gap fill.
Tools and Resources
Recommended Tools & Resources
Scope 3 Footprinting
Introduction to Scope 3 GHG Footprinting
Accounting for Renewable Energy, Natural Gas, Fleet, and Refrigerant Emissions
- Finally, you learned how to account for different types of energy data and how to gap fill for each.
Chapter 3: Scope 3 Footprinting Footprinting
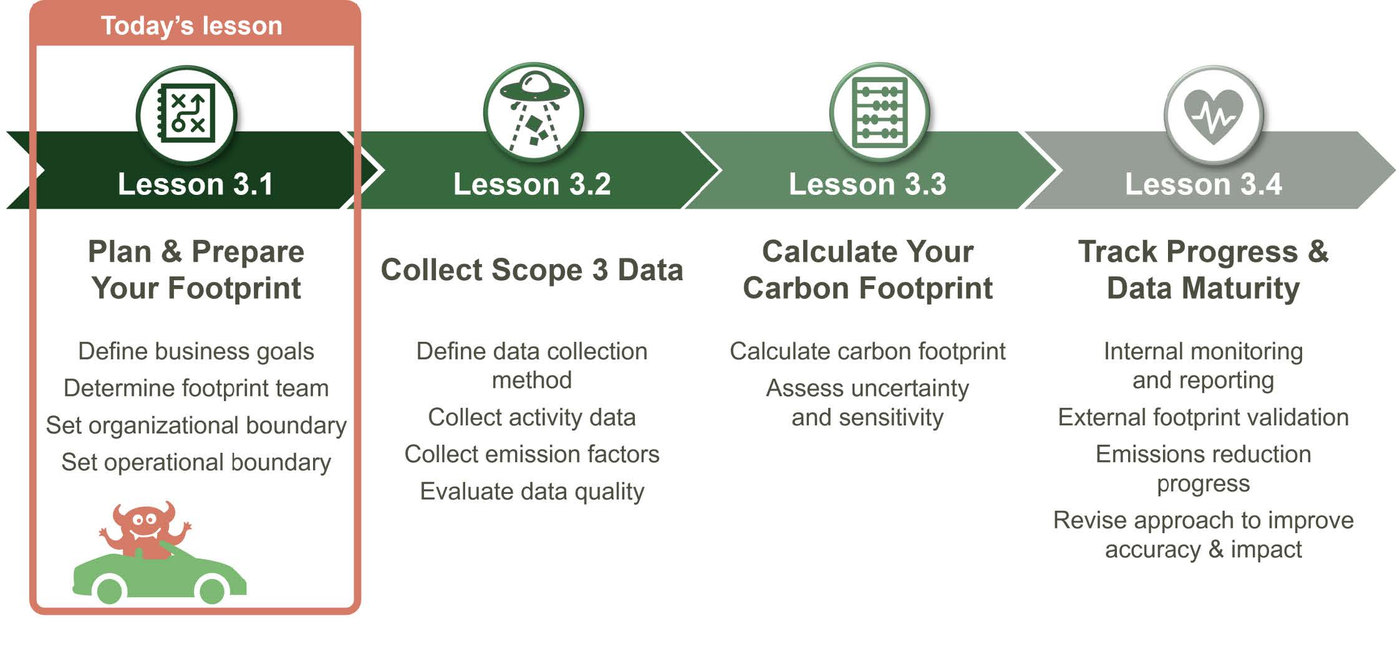
In this lesson, you will be introduced to Scope 3 greenhouse gas (GHG) emissions. Throughout Chapter 3, you will gain a comprehensive understanding of what Scope 3 emissions are, why they are important to account for, and how to develop a Scope 3 emissions footprint.

What you will learn
- Understand Scope 3 GHG emissions and determine your top emitting Scope 3 categories.
- Learn about data collection approaches and gather the data required to develop your Scope 3 footprint.
This figure shows the Chapter 3 Overview. Lesson 3.1 focuses on planning and prepare to create your scope 3 footprint.
Read: Skills You Need to Succeed
Let's Talk About Skills that Will Help You Succeed in Scope 3 Footprinting
Similar to the skills required for completing a Scope 1 and 2 greenhouse gas (GHG) footprint, a combination of technical and interpersonal skills will support your success.
The skills outlined below are consistent with those introduced in Lesson 2.1. Please take a moment to review them, as they will help prepare you to develop your own Scope 3 footprint.
Hard Skills
Microsoft Excel
- Know the basics of Excel; this is where you will be calculating your footprint, collecting data for your footprint, and storing the data.
Math Skills
- Many tasks go into developing your footprint, including quite a bit of math, such as unit conversions, multiplication, and division.
Communication
- Know when to ask for help and clearly explain what you are looking for and why.
Soft Skills
Critical Thinking
- It is important to be able to take what you are learning and think about how it applies directly to your own organization.
Time Management
- The steps to calculate your footprint take time; it is important to stay on track.
Self-starter
- Take initiative to help your organization make progress towards its climate goals!
Reminder: GHG Emissions
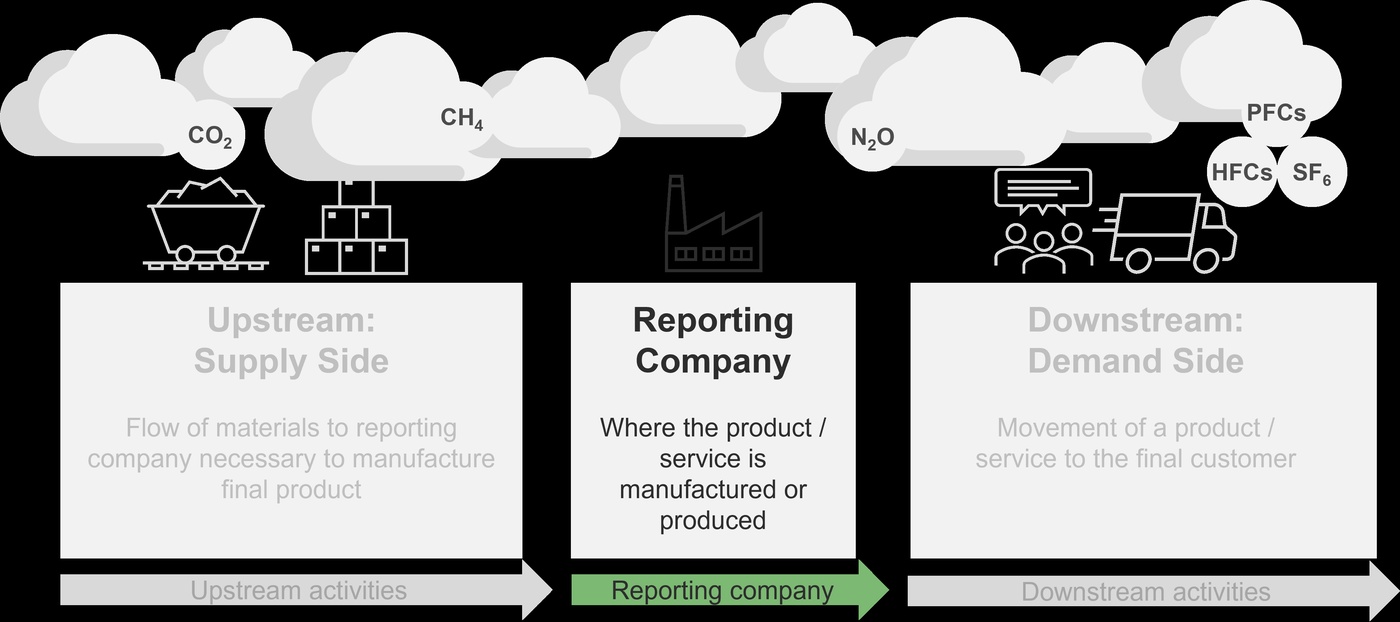
GHG Emissions Exist Across the Entire Value Chain
Emissions occur in three major categories: reporting company, upstream, and downstream.
Reporting Company
The activities included in this portion of a footprint will vary by company and what is within a company's operational control.
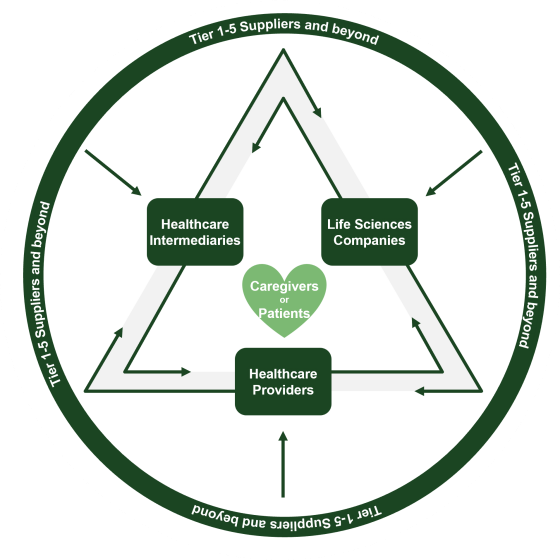
Reporting Company Scope 3 Emissions Examples:
- Tier 1-5 Suppliers: Manufacturing of plastic for an MRI machine
- Life Sciences Companies: Manufacturing of the MRI machine
- Healthcare Intermediaries: Equipment energy usage to store and break down the manufactured MRI machine
- Healthcare Providers: Energy usage associated with the use of the MRI machine
Upstream: Supply Side
Upstream of the reporting company is where your suppliers lie. This is where healthcare companies consider their different sourcing and procurement options.
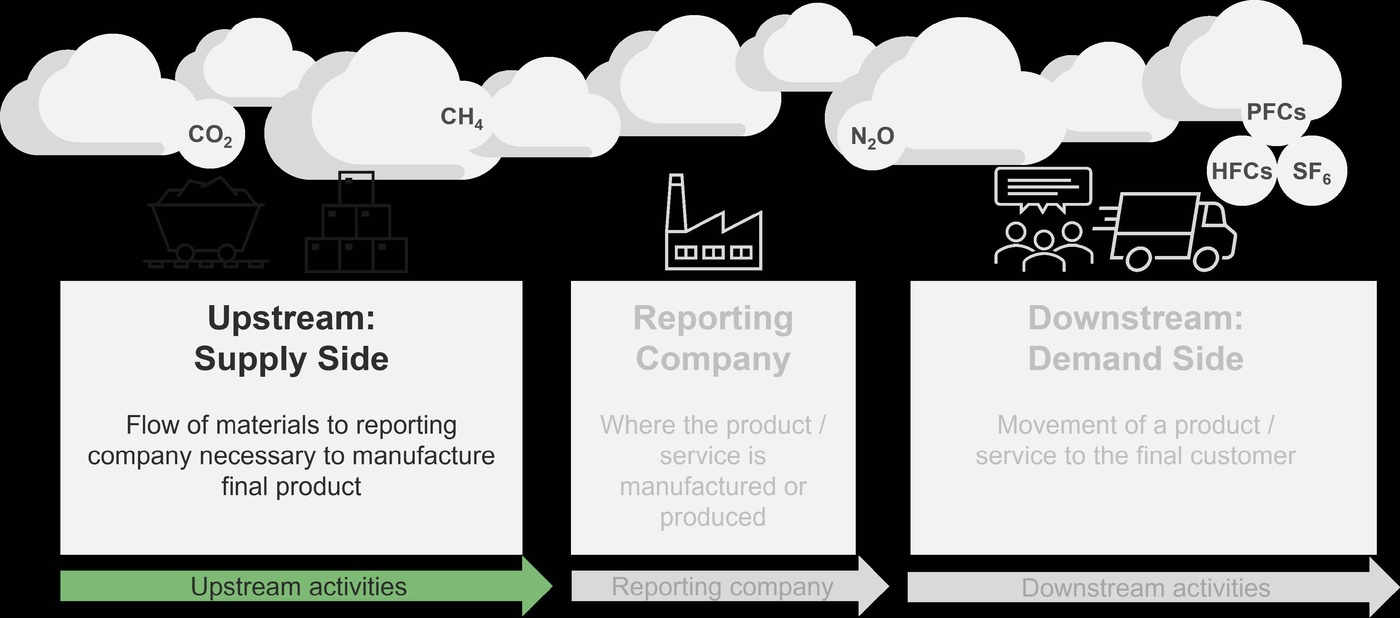
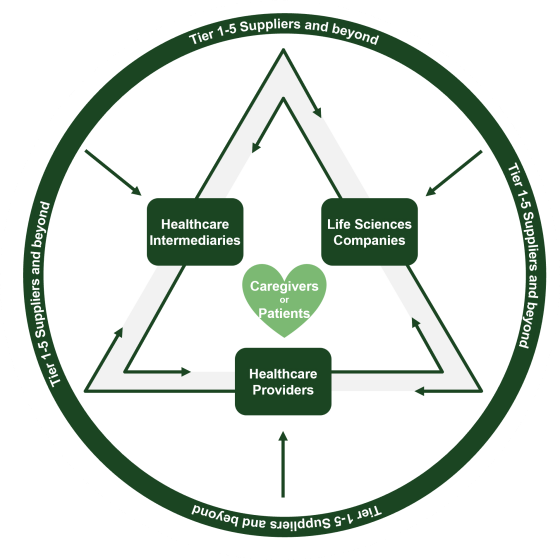
Upstream Scope 3 Emissions Examples:
- Tier 1-5 Suppliers: Transportation of raw materials to create the plastic
- Life Sciences Companies: Transportation of plastic from the supplier to the final MRI machine manufacturing site
Downstream: Demand Side
Downstream — the demand side — is where healthcare companies consider the delivery of services and products to patients.
Healthcare Considerations for Downstream:
- Healthcare Intermediaries: Transportation of manufactured MRI machine to the warehouse
- Healthcare Providers: Transportation of manufactured MRI machine from the warehouse to the patient care site and disposal of the MRI machine
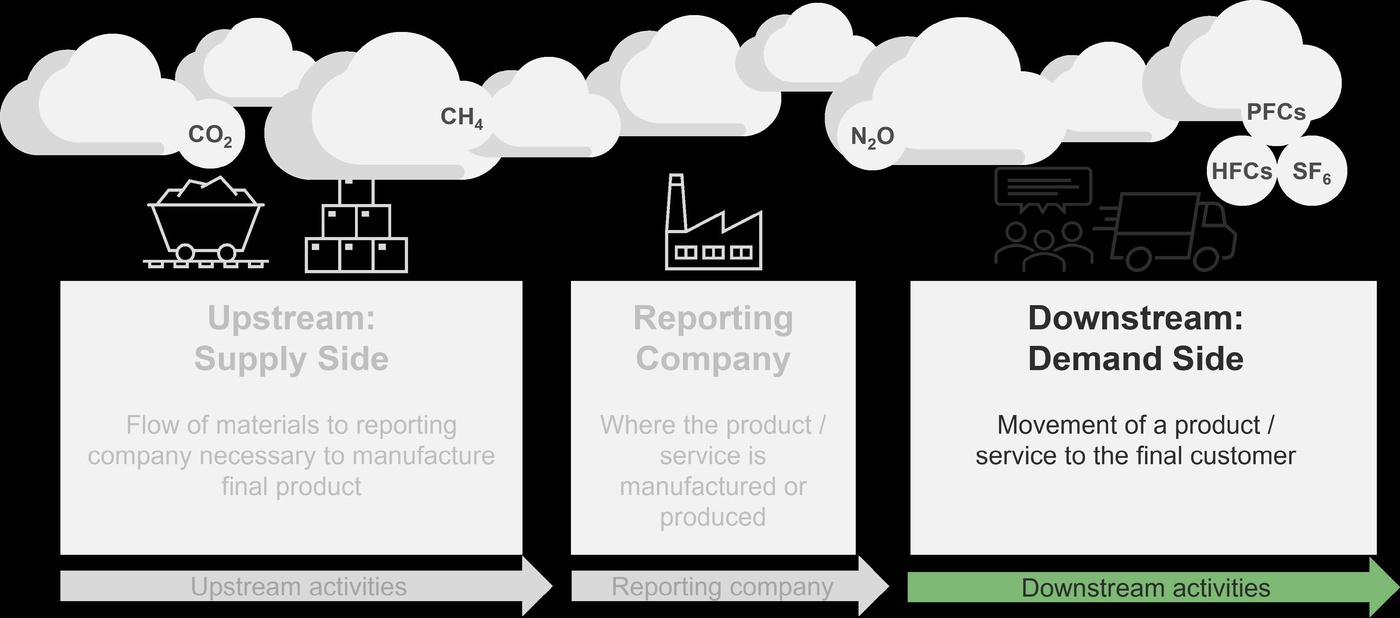
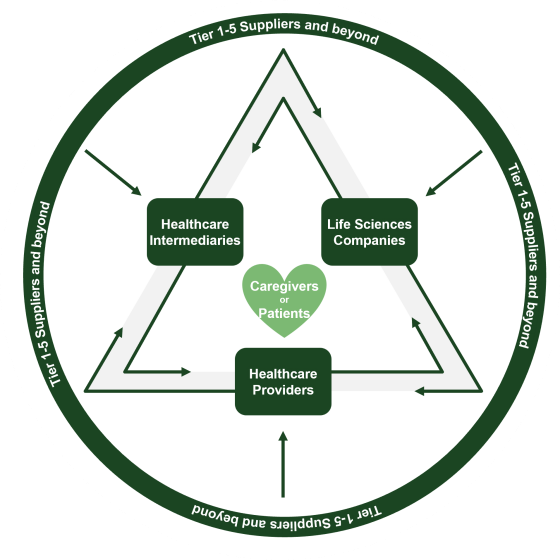
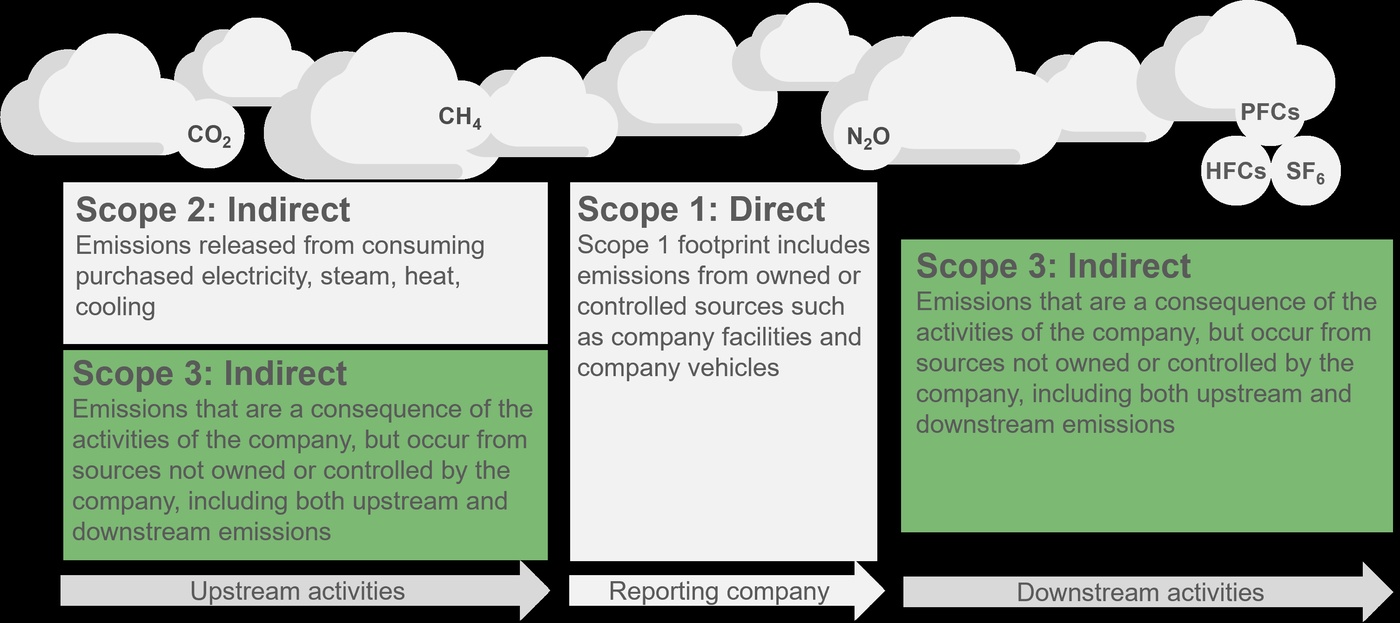
Reminder: Scope 1 emissions are those that occur directly at the reporting company (owned facilities and company vehicles). Scope 2 emissions are all those related to purchased energy (electricity, steam, heat, or cooling). Although Scope 2 is indirect, it is under the reporting company's operational control and is therefore not included in Scope 3.
Scope 3 emissions refer to all indirect greenhouse gas (GHG) emissions that occur in a company’s value chain, both upstream and downstream, but not from sources owned or directly controlled by the company. These emissions are sorted into categories, including purchased goods and services, transportation, waste disposal, use of sold products, employee commuting, and more.
Unlike Scope 1 (direct emissions from owned sources) and Scope 2 (indirect emissions from purchased energy), Scope 3 emissions are often the largest portion of a company’s carbon footprint — sometimes up to 95%

Broader Range of Considerations than Scope 1 & 2

Requires Looking Outside Your Operations

Requires Collaboration with a Broader Set of Internal and External Stakeholders

Relies More on Estimation and Assumptions from Secondary Data
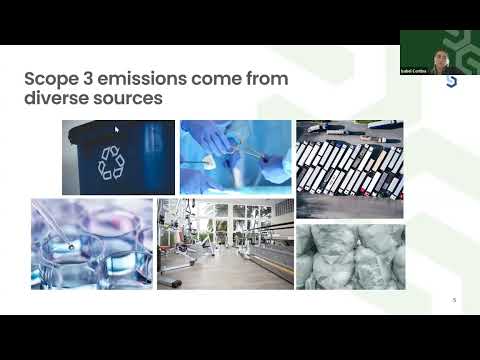
Considers Widely Diverse Sources of Emissions
Calculating Scope 3 Emissions Can Seem Like a Monstrous Task
We understand that the effort to calculate Scope 3 emissions can seem daunting, but this course is structured to help gradually build and develop your footprint. Additionally, we are here to support you in making your Scope 3 footprint calculations manageable.
Your LOCT for healthcare instructors and experts are here to support you!
Read: Scope 3 Categories
There Are 15 Scope 3 Categories to Consider for Your Footprint
Scope 3 can be complicated; we recommend reading more about each category to get a better understanding of each and how they might apply to your business. It is important to note that not every category will be relevant to your company.
NOTE — Several categories have specific considerations in healthcare. Be sure to look into purchased goods and services, capital goods, and use of sold products for additional insights below.
Upstream Categories
Purchased Goods and Services
- Source: GHG Protocol Guidance
- This category includes all upstream (i.e., cradle-to-gate) emissions from the production of products purchased or acquired by the reporting company in the reporting year. Products include both goods (tangible products) and services (intangible products).
- Category 1 includes emissions from all purchased goods and services not otherwise included in the other categories of upstream Scope 3 emissions (i.e., category 2 through category 8). Specific categories of upstream emissions are separately reported in category 2 through category 8 to enhance the transparency and consistency of Scope 3 reports.
- Healthcare Consideration
- Tier 1-5 Suppliers
- Production of raw materials purchased to develop a chemical compound.
- Life Sciences Companies
- Production of raw materials purchased from tier 1-5 suppliers (including chemicals, packaging, clinical research, etc.) to develop a pharmaceutical.
Capital Goods
- Source: GHG Protocol Guidance
- This category includes all upstream (i.e., cradle-to-gate) emissions from the production of capital goods purchased or acquired by the reporting company in the reporting year. Emissions from the use of capital goods by the reporting company are accounted for in either scope 1 (e.g., for fuel use) or Scope 2 (e.g., for electricity use), rather than in Scope 3.
- Capital goods are final products that have an extended life and are used by the company to manufacture a product, provide a service, or sell, store, and deliver merchandise. In financial accounting, capital goods are treated as fixed assets or as plant, property, and equipment (PP&E). Examples of capital goods include equipment, machinery, buildings, facilities, and vehicles.
- Healthcare Consideration
- Tier 1-5 Suppliers
- Machinery used to manufacture the raw material.
- Healthcare Intermediaries
- Machinery used to manage warehousing.
- Healthcare Providers
- Machinery like HVAC, X-Ray Machinery, etc.
Fuel and Energy-related Activities
- Source: GHG Protocol Guidance
- This category includes emissions related to the production of fuels and energy purchased and consumed by the reporting company in the reporting year that are not included in Scope 1 or Scope 2.
- Category 3 excludes emissions from the combustion of fuels or electricity consumed by the reporting company because they are already included in Scope 1 or Scope 2. Scope 1 includes emissions from the combustion of fuels by sources owned or controlled by the reporting company. Scope 2 includes the emissions from the combustion of fuels to generate electricity, steam, heating, and cooling purchased and consumed by the reporting company.
Upstream Categories (Continued)
Category 4: Transportation and Distribution
Source: GHG Protocol Guidance
This category includes emissions from:
- Transportation and distribution of products purchased in the reporting year, between a company's tier 1 suppliers and its own operations in vehicles not owned or operated by the reporting company (including multi-modal shipping, but excluding fuel and energy products)
- Third-party transportation and distribution services purchased by the reporting company in the reporting year, including inbound logistics, outbound logistics (e.g., of sold products), and third-party transportation and distribution between a company's own facilities
Emissions may arise from:
- Air transport
- Rail transport
- Road transport
- Marine transport
- Storage of purchased products in warehouses, distribution centers, and retail facilities
Category 5: Waste from Operations
Source: GHG Protocol Guidance
This category includes emissions from third-party disposal and treatment of waste generated in the reporting company's owned or controlled operations in the reporting year, including both solid waste and wastewater. Waste treatment activities may include:
- Disposal in a landfill
- Disposal in a landfill with landfill-gas-to-energy (LFGTE)
- Recovery for recycling
- Incineration
- Composting
- Waste-to-energy (WTE) / energy-from-waste (EfW)
- Wastewater treatment
Category 6: Business Travel
Source: GHG Protocol Guidance
This category includes emissions from the transportation of employees for business-related activities in vehicles owned or operated by third parties, such as aircraft, trains, buses, and passenger cars. Emissions from business travel may arise from:
- Air travel
- Rail travel
- Bus travel
- Automobile travel (e.g., rental cars or employee-owned vehicles for business purposes)
- Other modes of travel
Category 7: Employee Commuting
Source: GHG Protocol Guidance
This category includes emissions from the transportation of employees between their homes and their worksites. Emissions from employee commuting may arise from:
- Automobile travel
- Bus travel
- Rail travel
- Air travel
- Other modes of transportation (e.g., subway, bicycling, walking)
Category 8: Leased Assets (Upstream)
Source: GHG Protocol Guidance
This category includes emissions from the operation of assets that are leased by the reporting company in the reporting year and not already included in the reporting company's Scope 1 or Scope 2 inventories. This category applies only to companies that operate leased assets (i.e., lessees). A reporting company's Scope 3 emissions from upstream leased assets include the Scope 1 and Scope 2 emissions of lessors.
Downstream Categories
Category 9: Transportation and Distribution (Downstream)
Source: GHG Protocol Guidance
This category includes emissions that occur in the reporting year from transportation and distribution of sold products in vehicles and facilities not owned or controlled by the reporting company. This category includes emissions from retail and storage, and only covers emissions from transportation and distribution of products after the point of sale.
Category 10: Processing of Sold Products
Source: GHG Protocol Guidance
This category includes emissions from the processing of sold intermediate products by third parties (e.g., manufacturers), subsequent to sale by the reporting company. Intermediate products require further processing, transformation, or inclusion in another product before use, and therefore result in downstream processing emissions.
Category 11: Use of Sold Products
Source: GHG Protocol Guidance
This category includes emissions from the use of goods and services sold by the reporting company. A reporting company's Scope 3 emissions from the use of sold products include the Scope 1 and Scope 2 emissions of end users. Emissions from use of sold products may be direct (e.g., fuel combustion) or indirect (e.g., electricity used to power a product).
Healthcare consideration — Life Sciences Companies: Energy usage for a biomedical device; nitrous oxide leaks when administering anesthesia.
Category 12: End-of-life Treatment of Sold Products
Source: GHG Protocol Guidance
This category includes emissions from the waste disposal and treatment of products sold by the reporting company at the end of their life. This category includes the total expected end-of-life emissions from all products sold in the reporting year. End-of-life treatment methods include landfilling, incineration, recycling, and other methods described in Category 5.
Category 13: Leased Assets (Downstream)
Source: GHG Protocol Guidance
This category includes emissions from the operation of assets that are owned by the reporting company (acting as lessor) and leased to other entities in the reporting year that are not already included in Scope 1 or Scope 2. This category applies to lessors (i.e., companies that receive payments from lessees).
Category 14: Franchises
Source: GHG Protocol Guidance
This category includes emissions from the operation of franchises not included in Scope 1 or Scope 2. A franchise is a business operating under a license to sell or distribute another company's goods or services within a certain location. Franchisors should account for the Scope 1 and Scope 2 emissions of franchisees in this category.
Category 15: Investments
Source: GHG Protocol Guidance
This category includes Scope 3 emissions associated with the reporting company's investments in the reporting year, not already included in Scope 1 or Scope 2. This category applies to investors and companies that provide financial services. Investment types include:
- Equity investments
- Debt investments
- Project finance
- Managed investments and client services
Applying Scope 3 to Your Organization
After clicking through the categories above, which do you think are your biggest Scope 3 categories?
Select all that apply, then click Reveal Answer.
There are no incorrect answers. Your biggest Scope 3 categories will depend on your company. Most companies' emissions fall into: Purchased goods and services, capital goods, transportation and distribution, and use of sold products. Some healthcare companies also have significant emissions in employee commuting and investments.
Watch: Why Scope 3 Emissions Matter
Your supply chain's emissions can account for the majority of your company's footprint.
Watch the video to learn about the importance of calculating and understanding your Scope 3 footprint.
Activity: Analyzing Scope 3 Emissions in Supply Chains
Illustrative Companies Refresher
| Formula Pharma | Apex Medical Supply & Device Company |
|---|---|
| Formula Pharma wants to set science-based targets for 2035 and 2050 and take active steps to reduce its emissions. Formula Pharma does not have a GHG footprint yet and wants to get started. | Apex Medical Supply & Device Company wants to set its Science-Based Targets for 2030 and 2050 and take active steps to reduce its emissions. They have started their footprinting journey, but they only have one iteration. |
Checking your knowledge on Scope 3 emissions
Which steps are a part of Scope 3 emissions for Formula Pharma?
Select all that apply.
Which steps are a part of Scope 3 emissions for Apex Medical Co?
Select all that apply.
Read: GHG Footprint Reminders
A GHG Footprint Captures the Total GHGs Generated by Human Activities
Footprints can quantify GHGs generated at different levels, including:
- Company level during one year of operations
- Product level during product lifetime
- Project level during project lifetime
This course focuses on the company-level footprint of your latest calendar or fiscal year.
This training follows GHG Accounting Standards! Use the link below to reference the standards for more information.
GHG Protocol Standards & Guidance: https://ghgprotocol.org/standards-guidance
Footprints Must Meet 5 GHG Protocol Standards
This is a reminder that GHG footprints, including Scope 3, must meet the 5 GHG Protocol Principles. The examples below are relevant to a Scope 3 footprint.
| Description | Example | ||
|---|---|---|---|
| 1 | Relevance | GHG inventory must contain all the relevant information that is required for decision-making. | A drug manufacturing company that has high expenses for the procurement of raw materials should make sure to collect accurate data for the category of Purchased Goods & Services. |
| 2 | Completeness | GHG inventory must have complete information regarding emission sources and activities within the selected boundary. | The drug company includes data for all its relevant Scope 3 categories, both upstream and downstream. |
| 3 | Consistenty | Use consistent methodologies to allow for meaningful comparisons of emissions over time. | The same data is collected, and a consistent methodology is used to calculate emissions year-over-year. |
| 4 | Transparency | Disclose assumptions clearly, factually, and neutrally by maintaining proper documentation. | The data collection process and calculation of emissions from upstream & downstream transportation are well-documented. |
| 5 | Accuracy | Maintain accuracy and reduce uncertainty while calculating emissions for proper decision-making. | The company uses country-specific data for electricity emissions to calculate upstream emissions from electricity in different parts of the world. |
Let's get to planning and preparing your Scope 3 footprint!

Read: Planning and Preparing Your Scope 3 Footprint
The first step in planning and preparing your Scope 3 footprint will be to draw from the resources and methodology you have put together for your Scope 1 and 2 footprint.
Steps to plan and prepare for your Scope 3 footprint:
- Define your business goals. Consider your company’s reasons for developing a Scope 3 GHG footprint. Examples include: responding to customer or investor requests, managing GHG risks (e.g., reputation, regulation, emission hotspots), identifying opportunities (e.g., operational cost savings, new markets/products, supply chain engagement), and public reporting and participation in voluntary & mandatory GHG programs.
- Refine your footprint team. The teams required to calculate a GHG footprint can vary depending on the size and complexity of your company and its climate maturity. Teams often include (but are not limited to): Procurement or Finance (e.g., purchased goods and services, capital goods), Facilities or Operations & Maintenance (e.g., electricity & fuel usage), Engineering, Sustainability Team, Environmental, Health, and Safety, Stakeholders and Suppliers, and Leader/executive sponsorship.
-
Set your organizational boundary. Your organizational boundaries determine which emissions are allocated to your Scope 1 & 2 footprint versus someone else’s. This step ensures your footprint is relevant and complete and prevents double-counting. Emissions within your organizational boundary fall into your Scope 1 & 2 footprint; emissions outside of your organizational boundary may fall into your Scope 3 footprint.
For most companies, operational control is the same as financial control (who gets to control financial decisions and gets economic benefit from activities) and is the most common and recommended approach. -
Identify locations and assets within your operational boundary. Ideally, you should include your global operations, but the GHG Protocol allows for regional boundaries. Operational boundaries recognize that emissions are split into three “scopes” based on assets under your control:
- Scope 1: Direct emissions for assets within your organizational boundary, including burning fuels and refrigerant leakage.
- Scope 2: Emissions resulting from generating electricity, heat, steam, or cooling that is purchased by your company for assets within your organizational boundary.
- Scope 3: Emissions generated from activities outside of your organizational boundaries but that result from your business activities.
Watch: Planning and Preparing for Apex and Formula Pharma's Scope 3 Footprints
Illustrative Companies and Their First Steps
Watch the video below to see how Apex Medical Co and Formula Pharma plan and prepare for their Scope 3 footprints.
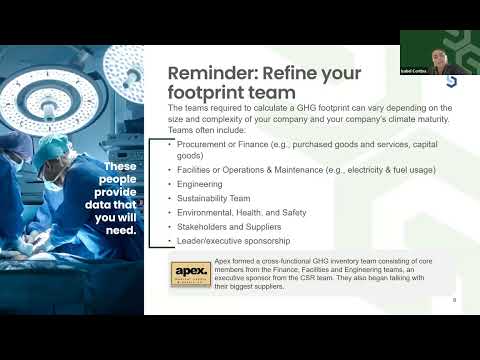
How to Collect and Refine Data for a Scope 3 Footprint
Planning and Preparing Your Scope 3 Footprint
- Before beginning the journey of Scope 3 footprinting, you must define your business goals, organizational and operational boundaries, and footprinting team.
This lesson will walk you through how to define, collect, and evaluate data for your Scope 3 footprint.

What you will learn
- Understand which data collection method to use.
- Learn how to collect activity data.
- Learn how to collect relevant emission factors.
- Understand how to evaluate data quality.
This figure shows the Chapter 3 Overview. Lesson 3.2 focuses on how to collect data for your scope 3 footprint.
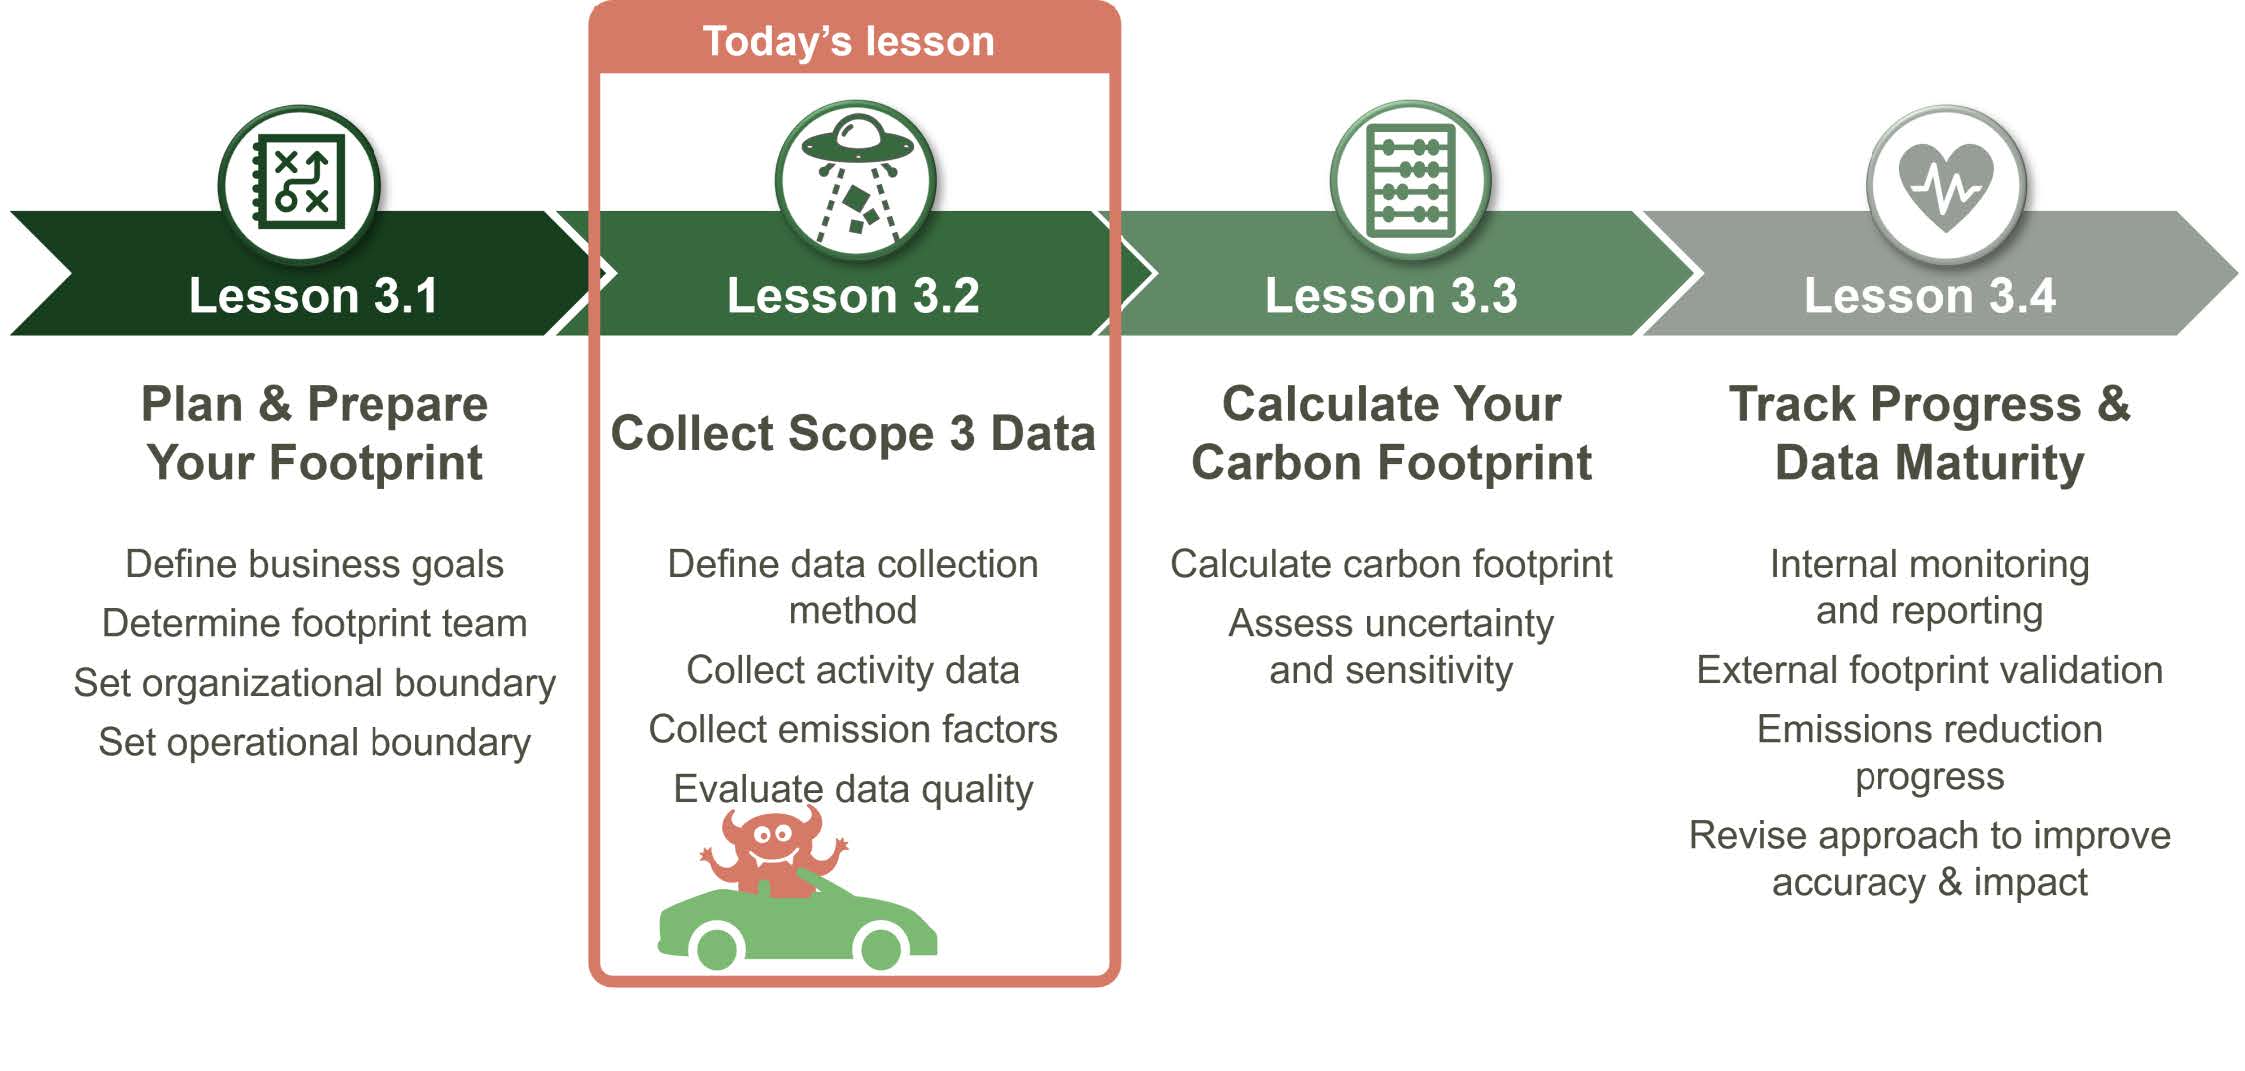
Read: Defining Your Required Activity Data
Let's Think About Our End Goal... Calculating Emissions
Core Formula: Activity Data X Emission Factor = GHG Emissions
Remember the formula to calculate greenhouse gas emissions? Let's think about it in a Scope 3 context using our favorite companies: Formula Pharma and Apex!
| Formula Pharma | Apex Medical Supply & Device Company |
|---|---|
| Formula Pharma wants to set science-based targets for 2035 and 2050 and take active steps to reduce their emissions. Formula Pharma does not have a GHG footprint yet and wants to get started. | Apex Medical Supply & Device Company wants to set their Science Based Targets for 2030 and 2050 and take active steps to reduce their emissions. They have started their footprinting journey but only have one iteration. |
Click Through the List Below to See How the Illustrative Companies Should Calculate the Emissions for:
Formula Pharma's API (Active Pharmaceutical Ingredient) they purchased Apex's plastic they purchased to develop its medical devices
-
Collect the activity data
Formula Pharma: Purchased 80 tonnes of API (Active Pharmaceutical Ingredient) for their drug development.
Apex: Purchased 158 tonnes of plastic this year which was used to develop medical devices.
-
Identify the appropriate emissions factor
Formula Pharma: Finds an API specific emission factor: 1.343 kg CO2e / tonne API
Apex: Finds a plastic specific emission factor: 2.792 kg CO2e / tonne plastic
-
Calculate GHG emissions
Activity data × Emission factor = GHG emissions
Formula Pharma:
Activity Data: 80 tonnes | Emission Factor: 1.343 kg CO2e / tonne API- Activity Data × Emission factor = 80 tonnes × 1.343 kgCO2e / tonne API = 107.44 kgCO2e
- Convert to MTCO2e (most common way emissions are displayed): 1 kg = 0.001 MT
- 107.44 kgCO2e × (1 MT / 1,000 kg) = 0.11 MTCO2e
Apex:
Activity Data: 158 tonnes | Emission Factor: 2.792 kgCO2e / tonne plastic- Activity Data × Emission factor = 158 tonnes × 2.792 kgCO2e / tonne plastic = 441.136 kgCO2e
- Convert to MTCO2e (most common way emissions are displayed): 1 kg = 0.001 MT
- 441.136 kgCO2e × (1 MT / 1,000 kg) = 0.44 MTCO2e
Read: the 3 Stages of Gathering Activity Data
Gathering Scope 3 Data Happens in 3 Main Stages

Define
The type, quality, and quantity of data required to set clear requirements for your data providers.

Collect
The required data from your data providers in a timely manner.

Refine
The data to align with GHG accounting standards and continuously improve the accuracy and consistency of your footprint.
Recall our previous lesson — we discussed Scope 3 categories, and which ones would be most applicable to your organization. Before answering the forthcoming poll — consider the expected impact of each category on your business and the top emitting sources.
Confused about your top Scope 3 emitting categories?
If you do not know your top Scope 3 emitting categories, work with your footprinting team to identify them. If you do not have a team established yet — consult internal stakeholders that hold the key data you are looking for (e.g., procurement managers, HR, sustainability team members)
YOUR TOP SCOPE 3 CATEGORIES MIGHT INCLUDE:
Purchased goods & services: What products or services does your company purchase? Capital goods: What large pieces of equipment or fleet vehicles does your company purchase? Use of sold products: How is the final product being used? What is the energy consumption associated with the usage of the final product? Who is the end customer?
Consult the GHG Protocol for additional guidance on which activities should fall into each Scope 3 category: The GHG Protocol Scope 3 Standard.
Activity: Gathering Activity Data for Top Categories

Formula Pharma is back..
The company has identified its top emitting categories; now they want to determine the key activities within those categories to coordinate data collection.
Click through below to take a look into its top categories and the associated emitting activities!
Purchased Goods and Services (Category 1)
- Contract manufacturing organization (CMO) and chemicals
- Services: Clinical trial services
- CMO represents the largest amount of annual spend, making it a priority to capture high-quality data
Upstream / Downstream Transportation and Distribution (Categories 4 and 9)
- Transportation of product to wholesalers, pharmacies, and hospitals
- Upstream: Air transit represents 70% of all third-party transport of products from suppliers to Formula Pharma
- Downstream: Road transit represents 80% of all third-party transportation of products sold by Formula Pharma to end consumers
End-of-life Treatment of Sold Products (Category 12)
- Sold products (e.g., medicine).
- Medicinal products account for 65% of all end-of-life disposal for Formula Pharma.
Read: Activity Data
There Are Two Types of Activity Data
Primary
- Definition: Direct measurement data from activities within a company's value chain.
- Includes: Meter readings, purchase records, utility bills, volume of raw materials purchased, and direct monitoring of emissions.
- Units: Typically, directly measured quantities (e.g., weight, volume, distance) of emissions.
Secondary
- Definition: Data that is not directly from the activities within a company's value chain.
- Includes: Industry-average data (e.g., published databases, government statistics, industry associations), financial data, and proxy data.
- Units: Typically, directly measured cost, square footage, or industry averages of primary data.
You can gather data from several sources
Primary
Data sources
- Procurement databases
- Invoices
- Product labels or specifications
- Waste or other service contractors
- Travel reports
- Supplier surveys
Secondary
Data sources
- Industry reports
- National statistics
- Academic studies
- Verified peer carbon footprints
- Environmental Product Declarations
- Financial records
Each type of data has pros and cons.
Primary
- Advantages: Provides a better representation of a company's specific value chain activities and enables performance tracking and benchmarking.
- Disadvantages: May be costly or difficult to determine or verify the source and quality of data supplied by value chain partners.
Secondary
- Advantages: Allows companies to calculate emissions when primary data is unavailable or insufficient. Can be useful for accounting for emissions from minor activities and can be more cost-effective and easier to collect than primary data.
- Disadvantages: Data may not be representative of a company's specific activities and may limit ability to track progress toward GHG reduction targets.
Primary and secondary data: Purchased goods and services example
Primary
- Emission data from suppliers of goods and services attributed to the products/services you purchased, or Product Carbon Footprint (PCF) data directly from the supplier.
- (For example, PCF for API or packaging).
- Quantities or weights of purchased materials & goods from invoices or procurement data.
- (For example, total weight of purchased packaging material).
- Cost of purchased services not included in payroll.
Secondary
- Cost of purchased materials & goods with clear material description.
Activity: Determining Data Collection Methods
Methods to Collect Activity Data
It is important to always try to collect the most accurate data possible. Companies new to footprinting should follow the graphic below (along with our hiker).
Applying Data Activity Types to the Data Collection Methodology
Want more examples?
Visit Chapter 7 of the GHG Protocol: Corporate Value Chain (Scope 3) Accounting and Reporting Standard to learn more about the different data collection methods for each Scope 3 category.
Corporate Value Chain (Scope 3) Accounting & Reporting Standard: https://ghgprotocol.org/sites/default/files/standards/Corporate-Value-Chain-Accounting-Reporing-Standard_041613_2.pdf
Quiz
Note: 55% of Formula Pharma’s raw material purchases are related to CMO and chemicals (API).Given that Formula Pharma is new to footprinting, which data collection Method should Formula Pharma ideally use to most accurately capture the emissions related to CMO and chemicals?
Select one answer.
Read: Working with Data Providers
Key considerations when working with data providers..
| Timeframe | Due Date | Categories | Data Types |
|---|---|---|---|
| The data should represent a certain timeframe (e.g. fiscal year 2023) | When you need to receive the data from the provider / data owner | The category(ies) of data required (e.g. raw material purchases, separated out by category) | The type of data required (e.g., spend or activity based); or, setup a meeting to discuss what type is available and how easily accessible it is |
| Challenges | Guidance |
|---|---|
| Lack of experience in GHG inventories and accounting |
|
| Lack of transparency in data quality |
|
| Lack of capacity and resources in tracking data |
|
Reminder: Footprints must meet the 5 GHG Protocol principles
-
Relevance
GHG inventory must contain all the relevant information that is required for decision-making.
Example: A drug manufacturing company that has high expenses for the procurement of raw materials should make sure to collect accurate data for the category of Purchased Goods & Services.
-
Completeness
GHG inventory must have complete information regarding emission sources and activities within the selected boundary.
Example: The drug company includes data for all its relevant Scope 3 categories, both upstream and downstream.
-
Consistency
Use consistent methodologies to allow for meaningful comparisons of emissions over time.
Example: The same data is collected and a consistent methodology is used to calculate emissions year-over-year.
-
Transparency
Disclose assumptions clearly, factually, and neutrally by maintaining proper documentation.
Example: The data collection process and calculation of emissions from upstream & downstream transportation are well-documented.
-
Accuracy
Maintain accuracy and reduce uncertainty while calculating emissions for proper decision-making.
Example: The company uses country-specific data for electricity emissions to calculate upstream emissions from electricity in different parts of the world.
Activity: Working with Data Providers
Data collection best practices
Apex Medical Supply & Device Company asked its footprinting team to detail best practices in data collection based on their experience. Which of these is a best practice?
Select one answer.
Your Data Collection Approaches Will Improve over Time
Collecting data for your footprint is a continuous improvement process that usually takes 1-2 years of data management to perfect.
Even if imperfect — it's important to get started with what you have!
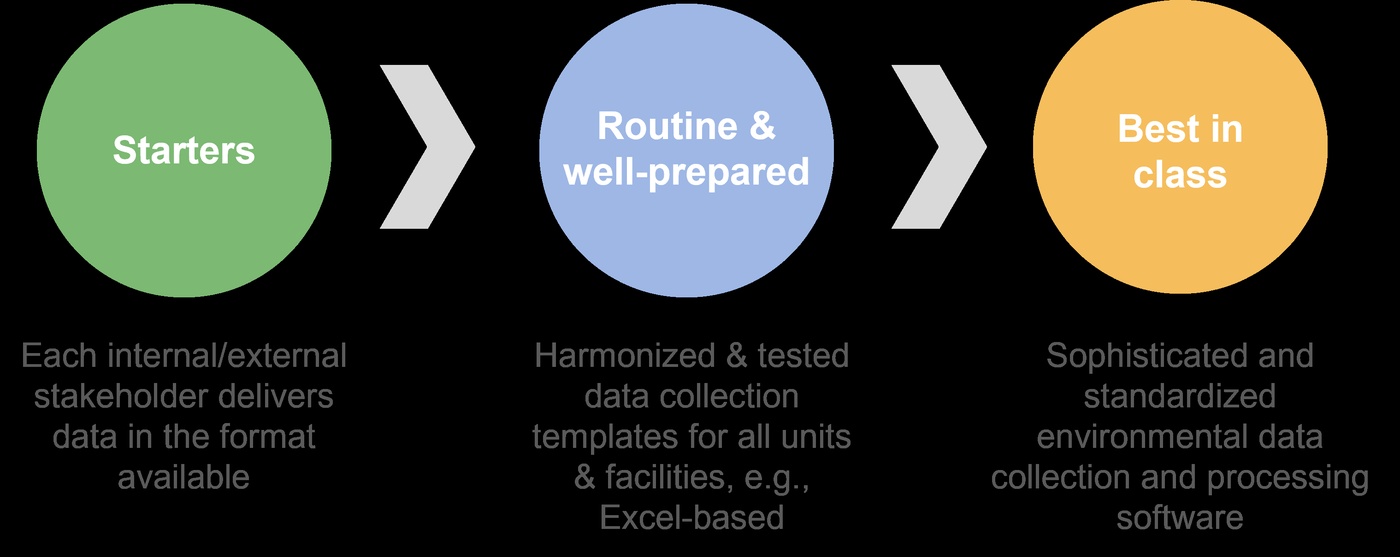
Starters: Allow for Flexibility in Inputs
In the first round of creating a carbon footprint, inputs likely come in many different formats:
- Different Excel files
- Invoices
- Database excerpts
- Emails
- Flexibility for data providers
- Data is often available without much preparation
- Harmonizing and data quality checks remain with the carbon footprint team
Routine and Well-prepared: Establish an Organized Way to Collect Your Data
Example: Excel-based harmonized data collection template for Category 1 — Purchased Goods & Services.
- Data is received in the required format
- Easier to check for quality and completeness
- Less flexibility on data input side
- Still individual data files
Best in Class: Consistent, Verified, and Accurate Methodology
You have been doing a routine and well-prepared footprint for 1-2 years, with established methodologies and verified approaches.
Wrap up: Lesson 3.2
Lesson recap
How to Define and Calculate Emissions
Calculating emissions requires two figures: activity data and an emission factor.
Activity data × Emission factor = GHG emissions.
Gathering Scope 3 data happens in three main stages: Define, Collect, Refine
Which Data Collection Approach to Employ
There are two types of activity data:
- Primary = direct measurement data from activities within a company’s value chain
- Secondary = data that is not directly from the activities within a company’s value chain
Collecting activity data depends on what level of data you have access to. The best data is right from the source, and will cascade in this order depending on its availability:
- Supplier-specific / fuel-based
- Average-data / distance-based
- Spend-based
How to Calculate Your Scope 3 Footprint
This lesson will guide you through calculating emissions in your carbon footprint using emissions factors. Once you've determined your total emissions, we’ll explore how to assess uncertainty and sensitivity within your footprint analysis.

What you will learn
- Learn how to determine accurate emission factors for your activity data.
- Understand how to calculate total emissions within your footprint.
- Discover how to assess uncertainty and sensitivity in data and calculations.
This figure shows the Chapter 3 Overview. Lesson 3.3 focuses on how to calculate your Scope 3 carbon footprint.
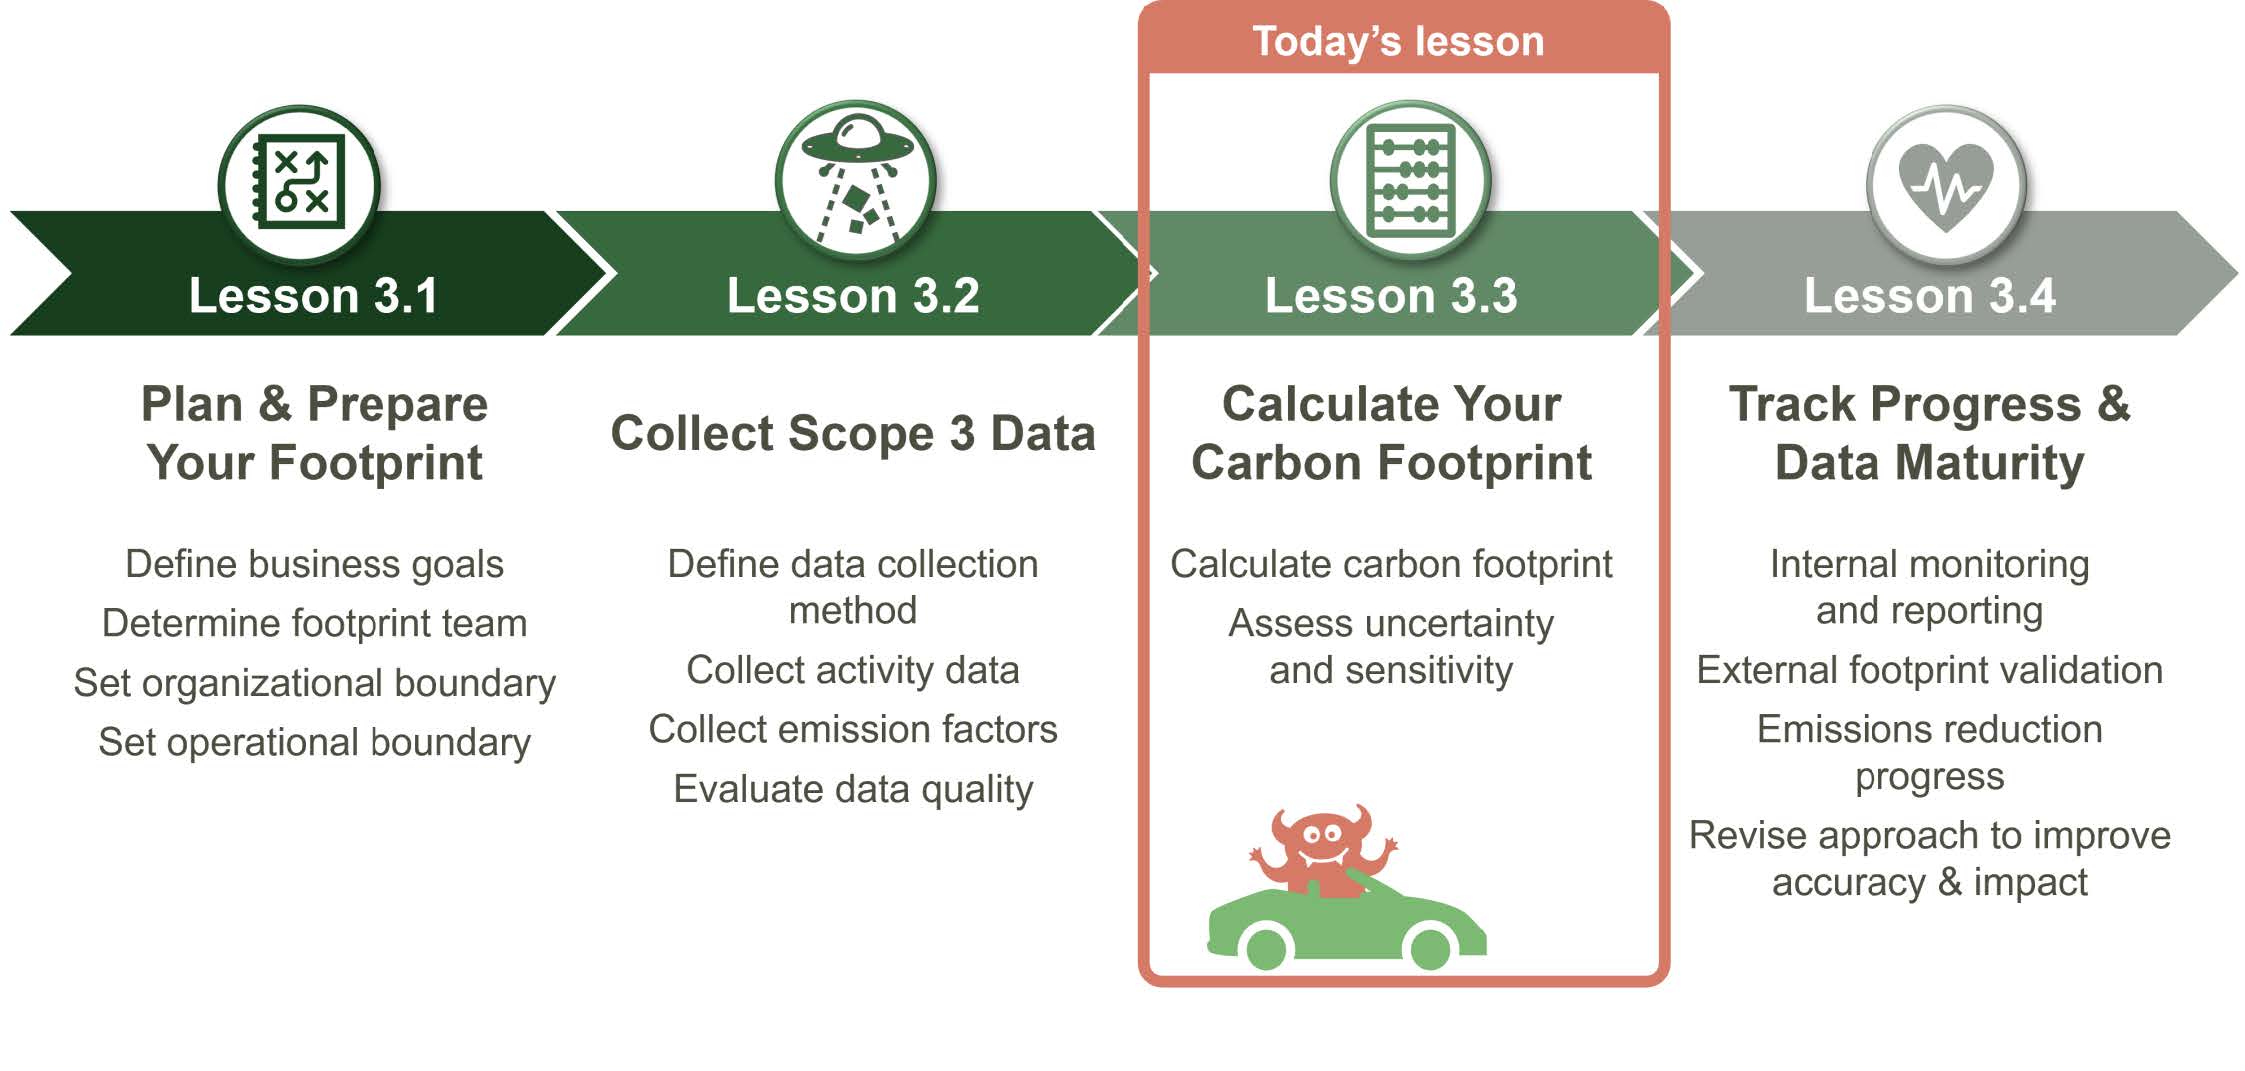
Read: How Emission Factors Contribute to the End Goal
End Goal Reminder
Core Formula: Activity Data X Emission Factor = GHG Emissions
You should be familiar with this formula by now, having applied it in the Scope 1 and Scope 2 footprinting lessons, as well as in the previous lesson focused on activity data.
In this lesson, we’ll shift our attention to the middle component of the formula: Emission Factors.
Read: How to Determine Emission Factors
Like Activity Data, Gathering Emission Factors Happens in Three Main Stages

Define
The type of emission factors needed to calculate emissions based on available activity data.

Collect
The required emission factors from databases and other resources.

Refine
The emissions factors based on the most updated databases aligned with your reporting year.
Activity Data Can Help Determine Emission Factors
In order to understand which emission factors to use in each scenario, you must understand what your activity data looks like.
For example, let's look at a calculation from each of our case study companies below.
Formula Pharma recorded 80 tonnes of API (active pharmaceutical ingredient) for one of their activities. Therefore, they found an emission factor that measures carbon emissions (kgCO2e) based tonnes of API. They multiplied the two figures together to arrive at their final total. IMPORTANT REMINDER: Always remember your conversions. In Formula Pharma's case, the emissions factor they used measures in kg, although they report their GHG totals in MT. The formula below includes this conversion, but does not show it. Apex recorded plastics in tonnes, so they found an emission factor that measures emissions based on tonnes of plastic. Notice here that the emission factor below is already in MT; therefore, they don't need a conversion for the final GHG emissions.
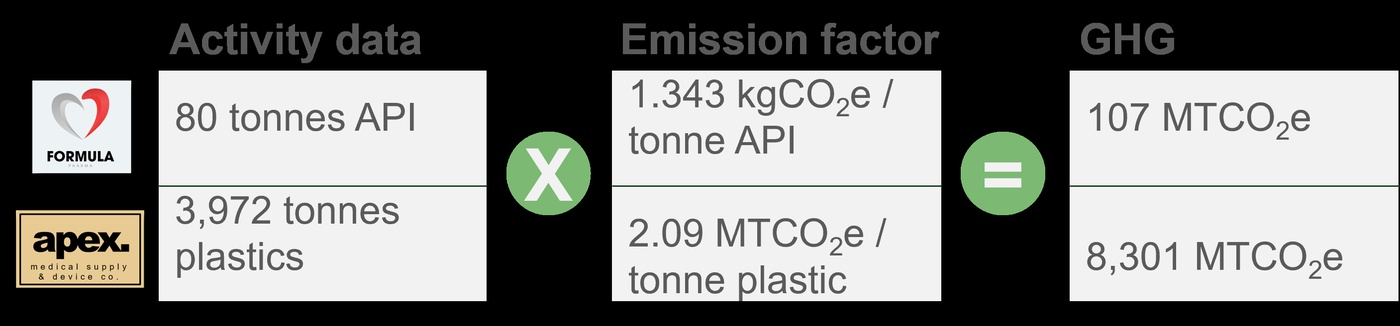
Watch: Applying Emission Factors to a Case Study
Formula Pharma and Their Emission Factors
Watch the video to explore the process of assigning emission factors based on activity data.
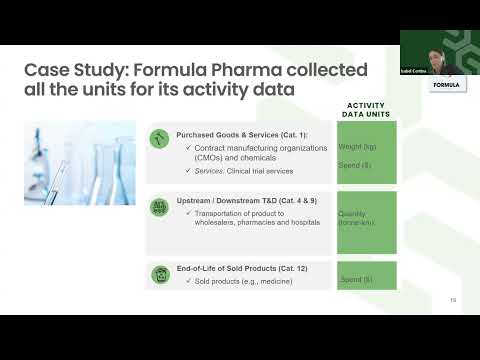
Applying emission factors to activity data
Formula Pharma has collected data on the quantity of HDPE (primary packaging, plastic bottle) from their largest supplier — Better Plastics Inc.Which of the following shows the correct emission factor unit they should seek for assigning an emission factor to the Better Plastics Inc. activity data?
Select one answer.
Read: Breakdown of Emission Factors
Emission Factors Are Split into the Same Two Categories as Activity Data
Primary
- Definition: Factors that are specific to a unique activity and consider characteristics such as location, technology, or other unique inputs.
- Example (Upstream / Downstream T&D): Emission factor for each fuel type by volume (e.g., emissions per liter of diesel, jet fuel).
Secondary
- Definition: Data from proxy sources or regional averages that often require additional manipulation.
- Example (Upstream / Downstream T&D): Industry/regional average emissions by transportation type (e.g., emissions per km for diesel road transit).
Like activity data, it's important to use primary sources when possible!
Similar to Scope 1 & 2 footprint calculations, you will choose emission factors based on their associated characteristics
There are many different emission factor sources and databases; therefore, you will need to look at your activity data and choose the emission factors whose characteristics match that activity data best.
There Are Four Categories of Emission Factor Characteristics that Will Help You Choose:
Geography
- Emission factors can be specific to a city, country, or region, or globally applicable.
Technology/Product
- Emission factors will differ based on the specifics of the underlying activity.
Year
- Many databases recalculate emission factors to incorporate updated methodologies or data on an annual basis.
Scope
- Emission factors can differ in the parts of an activity or product life cycle that they represent.
To choose accurate emission factors, begin with the most specific and reliable data available. Start by using physical primary or supplier-specific emission factors that directly reflect your company’s operations. If these are not accessible, shift to physical global or regional factors, which apply standardized metrics to your activity data. When neither physical nor supplier-specific data is available, use spend-based emission factors, which estimate emissions based on the financial cost of activities. This tiered approach ensures that your emissions calculations are as precise and representative as possible.
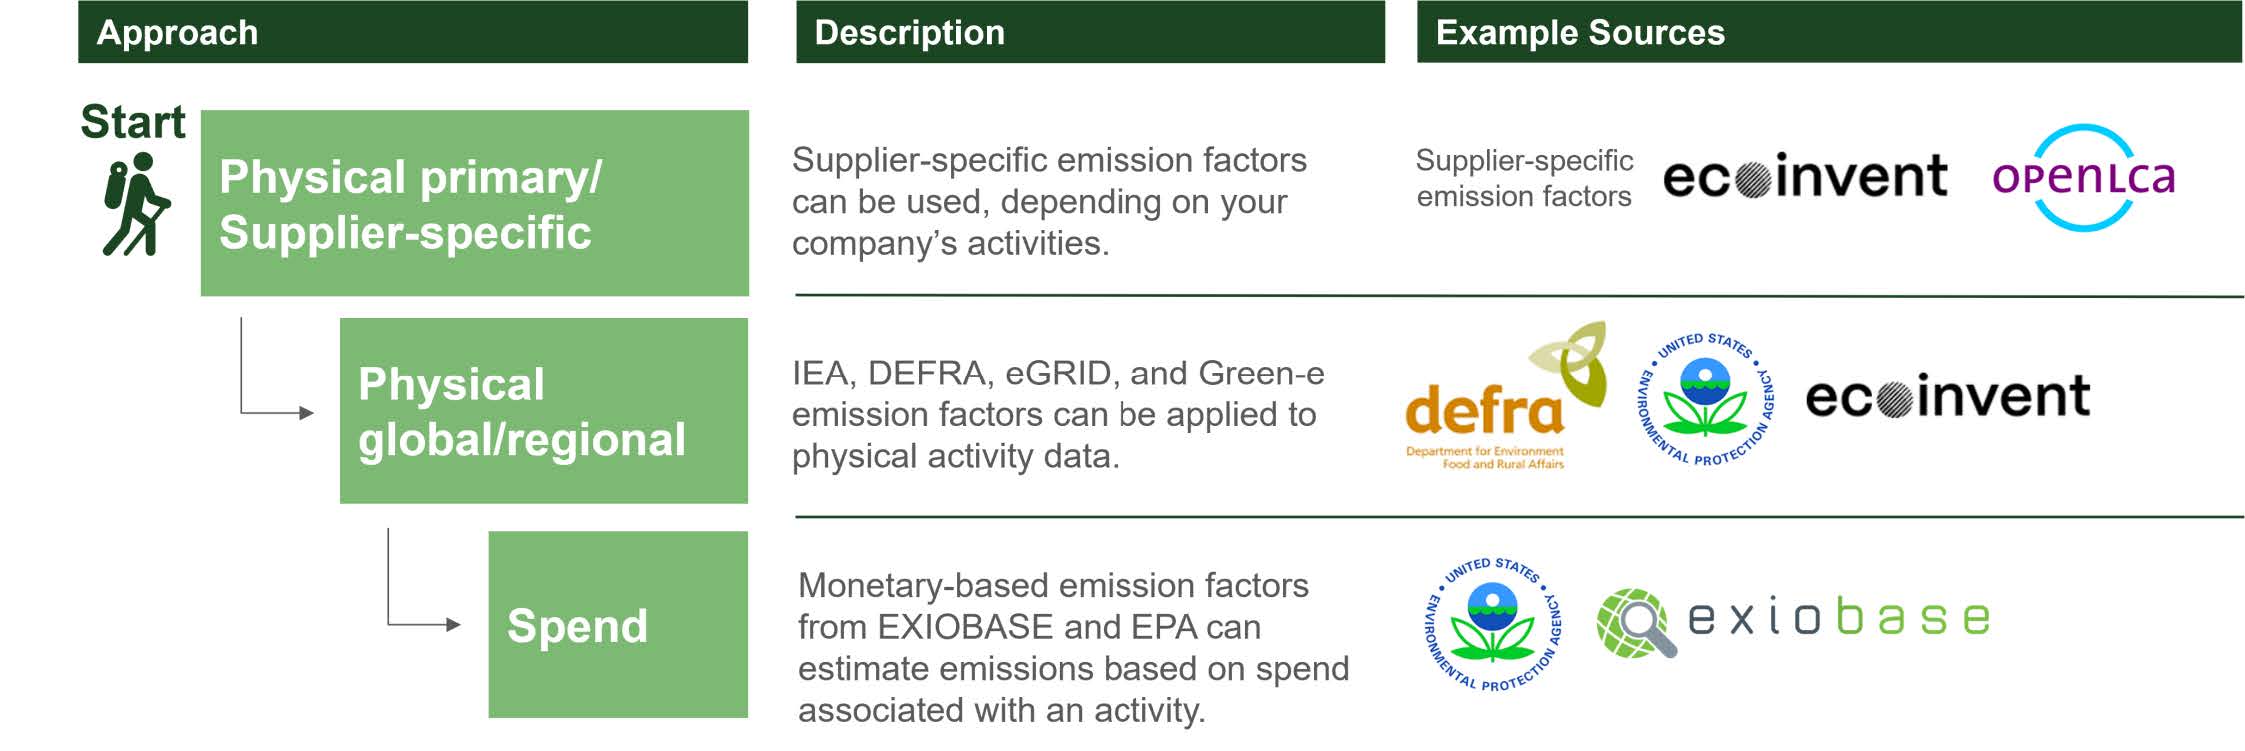
Reference: Scope 3 Categories and Their Activity Data and Emission Factor Databases
Activity Data
Category 1: Purchased Goods & Services (Upstream Activity)
- Scope 1 & 2 emissions data from suppliers of goods and services (if available); or Amount of (kg) or spend on (USD, EUR, etc.) goods purchased by type of good (e.g., raw materials, operating supplies, tools, etc.); or Spend on services by type of service (e.g., IT, consulting); or Expenditure by procurement/finance category or account name (e.g., from P&L), excluding expenses that do not have associated emissions, such as taxes, allowances, depreciation, amortization, interest, subscriptions.
GHG Protocol Reference: Chapter 1 — Technical Guidance for Calculating Scope 3 Emissions (PDF)
Category 2: Capital Goods (Upstream Activity)
- Scope 1 & 2 emissions data from suppliers of goods (if available); or Spend on (USD, EUR, etc.) large pieces of equipment and fleet vehicles (e.g., tractors, hardware, manufacturing equipment, etc.); or Total value of new assets purchased during the reporting year (e.g., expenditure by capital goods category from balance sheet).
GHG Protocol Reference: Chapter 2 — Technical Guidance for Calculating Scope 3 Emissions (PDF)
Category 3: Fuel & Energy Related Activities (Upstream Activity)
Same as Scope 1 & 2 activity data on fuels & energy:
- Stationary fuel use: Fuel consumption (volume or kWh) by fuel type; Calorific value of fuel(s) used (if available)
- Electricity use: Electricity consumption (kWh); Source (national grid, green electricity, onsite renewable, etc.)
- District heat/cooling/steam use: District heat/cooling/steam consumption (kWh)
GHG Protocol Reference: Chapter 3 — Technical Guidance for Calculating Scope 3 Emissions (PDF)
Category 4: Transportation & Distribution (Upstream Activity)
- Scope 1 & 2 emissions data from suppliers (if available); or Fuel consumption (volume) by fuel type and vehicle type/ transport mode (road, rail, air, etc.) from third-party partners (suppliers); or Distance and volume/weight transported by transport mode (ocean, rail, truck) from suppliers (tonne-km); or Spend if physical data above is not available.
GHG Protocol Reference: Chapter 4 & Chapter 9 — Technical Guidance for Calculating Scope 3 Emissions (PDF)
Category 5: Waste Generated in Operations (Upstream Activity)
- Scope 1 & 2 emissions data from suppliers (if available); or Waste generation (kg) by waste type and treatment/disposal type, by facility; or Wastewater generation (volume) by wastewater type and treatment type, by facility.
GHG Protocol Reference: Chapter 5 — Technical Guidance for Calculating Scope 3 Emissions (PDF)
Category 6: Business Travel (Upstream Activity)
- Business Trips: CO2 emissions from business trips (kg CO2e) by transport mode (air, rail, road, etc.); or Distance travelled by transport mode (air, rail, road, etc.; by flight class/individual flight distance in case of air travel) (passenger-km).
- Rental Cars: For rental cars, fuel consumption (volume) by fuel type and vehicle type, distance travelled, or days rented by vehicle type.
- Hotel Stays: Number of hotel nights for business trips by country.
GHG Protocol Reference: Chapter 6 — Technical Guidance for Calculating Scope 3 Emissions (PDF)
Category 7: Employee Commuting (Upstream Activity)
- Number of FTE Average commuting distance of employees Proportion of employees travelling by each transport mode (train, bus, car, taxi, motorbike, bike, walk).
GHG Protocol Reference: Chapter 7 — Technical Guidance for Calculating Scope 3 Emissions (PDF)
Category 8: Leased Assets (Upstream Activity)
- Scope 1 & 2 emissions or energy & fuel use from leased assets (facilities or vehicles) not captured in a company's Scope 1 & 2 data (leased assets that the company does not have operational control over)
- Alternatively: the floor area of these facilities per facility type (e.g., office, warehouse, store, manufacturing)
GHG Protocol Reference: Chapter 8 & Chapter 13 — Technical Guidance for Calculating Scope 3 Emissions (PDF)
Category 9: Transportation & Distribution (Downstream Activity)
- Scope 1 & 2 emissions data from third-party partner (if available) for transportation & distribution not paid for by your company; or Fuel consumption (volume) by fuel type and vehicle type/ transport mode (road, rail, air, etc.) from third-party partners; or Distance and volume/weight transported by transport mode from third-party partners (tonne- km); or Spend if physical data above is not available.
Category 10: Processing of Sold Products (Downstream Activity)
- Scope 1 & 2 emissions data from third-party facilities (if available/applicable), or Volume of product undergoing processing by downstream third-party facilities, by type of product, by type of processing, and by region.
GHG Protocol Reference: Chapter 10 — Technical Guidance for Calculating Scope 3 Emissions (PDF)
Category 11: Use of Sold Products (Downstream Activity)
- Description of how products are used throughout their lifetime
- Sales volumes by product type and by region where products are sold
- Total lifetime expected uses by product type
- LCA data for products that includes the use phase (if available); or Energy (electricity and fuel) consumption per use per product type (kWh/use or fuel volume/use)
GHG Protocol Reference: Chapter 11 — Technical Guidance for Calculating Scope 3 Emissions (PDF)
Category 12: End-of-Life Treatment of Sold Products
- Sales volumes by product and material type, and by final customer region in which products are used/thrown away (if different from where sold)
- Proportion of product waste being treated by different methods (e.g., percent landfilled, incinerated, recycled)
GHG Protocol Reference: Chapter 12 — Technical Guidance for Calculating Scope 3 Emissions (PDF)
Category 13: Leased Assets (Downstream Activity)
- Scope 1 & 2 emissions or energy & fuel use from assets (facilities or vehicles) leased by the company to third parties
- Alternatively: the floor area of these facilities per facility type (e.g., office, warehouse, store, manufacturing)
Category 14: Franchises (Downstream Activity)
- List of Scope 1 & 2 emissions from franchise operations' stores/offices/factories
- Alternatively: the floor area of these facilities per facility type (e.g., office, warehouse, store, manufacturing)
GHG Protocol Reference: Chapter 14 — Technical Guidance for Calculating Scope 3 Emissions (PDF)
Category 15: Investments (Downstream Activity)
- Share of equity or debt in the investee and annual revenue
- Scope 1 & 2 emissions of investments
- Calculating emissions from investments for a large portfolio is a complex task. More guidance on that topic can be found in the Partnership for Carbon Accounting Financials (PCAF) Standard
GHG Protocol Reference: Chapter 15 — Technical Guidance for Calculating Scope 3 Emissions (PDF)
Emission Factor Databases
Category 1: Purchased Goods & Services (Upstream Activity)
Sub-category: All Products
| Region | World |
|---|---|
| EF Name/Tab | Excel version not available, EF stored in database |
| Comment | Requires a license. |
| Region | World |
|---|---|
| EF Name/Tab | Spend/revenue |
| Comment | Sum of Scope 1, 2, & 3 upstream spend/revenue EFs per subcategory; use calculated global average or regional/country average; convert unit tCO2e/€M (2015). Note: EXIOBASE is a paid source. |
| Region | World |
|---|---|
| EF Name/Tab | Summary tab |
| Comment | EFs are in CO2, CH4, N2O — multiply by GWP and sum. May require adjustment for inflation. |
Sub-category: Water
| Region | World |
|---|---|
| EF Name/Tab | Water supply |
| Comment | No time lag. |
Category 2: Capital Goods (Upstream Activity)
Sub-category: All Products
| Region | World |
|---|---|
| EF Name/Tab | Excel version not available, EF stored in database |
| Comment | Requires a license. |
| Region | World |
|---|---|
| EF Name/Tab | Spend/revenue |
| Comment | Sum of Scope 1, 2, & 3 upstream spend/revenue EFs per subcategory; EXIOBASE is the preferred source. Note: EXIOBASE is a paid source. |
| Region | World |
|---|---|
| EF Name/Tab | Summary tab |
| Comment | EFs are in CO2, CH4, N2O — multiply by GWP and sum. May require adjustment for inflation. |
Category 3: Fuel & Energy Related Activities (Upstream Activity)
Sub-category: Fuels
| Region | World |
|---|---|
| EF Name/Tab | WTT - fuels; WTT - bioenergy, WTT - passenger vehicles & travel - land |
| Comment | No time lag. |
Sub-category: Electricity
UK DEFRA/BEIS and IEA
| Region | World |
|---|---|
| EF Name/Tab | DEFRA WTT - UK & overseas electricity generation + T&D; IEA T&D losses adjustment |
| Comment | No time lag for DEFRA; two-year lag for IEA. Sum of WTT electricity (generation) + WTT electricity (T&D) + T&D electricity. |
Sub-category: Heat, steam & cooling
| Region | World |
|---|---|
| EF Name/Tab | WTT - heat and steam + transmission and distribution |
| Comment | No time lag; Sum of CO2, CH4, and NO2; sum of WTT- heat and steam + WTT- district heat & steam distribution + distribution. |
Category 4: Transportation & Distribution (Upstream Activity)
| Region | World |
|---|---|
| EF Name/Tab | Freighting goods + WTT- delivery vehicles & freight (optional) |
| Comment | No time lag; Sum of CO2, CH4, and NO2. |
| Region | US |
|---|---|
| EF Name/Tab | Scope 3 Categories 4 and 9 (Table 8) |
| Comment | Convert CH4 and N2O to CO2e and sum up with CO2. |
Category 5: Waste Generated in Operations (Upstream Activity)
Sub-category: Waste
| Region | World |
|---|---|
| EF Name/Tab | Waste disposal |
| Comment | No time lag. |
| Region | World (Regional EF available for some categories) |
|---|---|
| EF Name/Tab | Excel version not available, EF stored in database |
| Comment | Requires a license. |
| Region | US |
|---|---|
| EF Name/Tab | Scope 3 Categories 5 and 12 (Table 9) |
| Comment | Convert CH4 and N2O to CO2e and sum up with CO2. |
Sub-category: Wastewater
| Region | World |
|---|---|
| EF Name/Tab | Water treatment |
| Comment | No time lag. |
Category 6: Business Travel (Upstream Activity)
Sub-category: Air travel
| Region | World |
|---|---|
| EF Name/Tab | Business travel - air + WTT- business travel - air (optional) |
| Comment | No time lag; Sum of CO2, CH4, and NO2. |
| Region | US |
|---|---|
| EF Name/Tab | Scope 3 Categories 6 and 7 (Table 10) |
| Comment | Convert CH4 and N2O to CO2e and sum up with CO2. |
Sub-category: Sea travel
| Region | World |
|---|---|
| EF Name/Tab | Business travel - sea + WTT- business travel - sea (optional) |
| Comment | No time lag; Sum of CO2, CH4, and NO2. |
Sub-category: Land travel (road & rail)
| Region | World |
|---|---|
| EF Name/Tab | Business travel - land + WTT- passenger vehicles & travel - land (optional) |
| Comment | No time lag; Sum of CO2, CH4, and NO2. |
| Region | US |
|---|---|
| EF Name/Tab | Scope 3 Categories 6 and 7 (Table 10) |
| Comment | Convert CH4 and N2O to CO2e and sum up with CO2. |
Sub-category: Hotel nights
| Region | World |
|---|---|
| EF Name/Tab | Hotel stay |
| Comment | No time lag. |
Category 7: Employee Commuting (Upstream Activity)
| Region | World |
|---|---|
| EF Name/Tab | Business travel - land + WTT- passenger vehicles & travel - land (optional) |
| Comment | No time lag; Sum of CO2, CH4, and NO2; EF used for bicycle and walk is zero. |
Category 8: Leased Assets (Upstream Activity)
Same as Scope 1 & 2 or supplier-specific data. Revisit Chapter 2, Lesson 3 for a comprehensive list of relevant emission factors.
Category 9: Transportation & Distribution (Downstream Activity)
| Region | World |
|---|---|
| EF Name/Tab | Freighting goods + WTT- delivery vehicles & freight (optional) |
| Comment | No time lag; Sum of CO2, CH4, and NO2. |
| Region | US |
|---|---|
| EF Name/Tab | Scope 3 Categories 4 and 9 (Table 8) |
| Comment | Convert CH4 and N2O to CO2e and sum up with CO2. |
Category 10: Processing of Sold Products (Downstream Activity)
Specific to each company.
Category 11: Use of Sold Products (Downstream Activity)
Specific to each company.
Category 12: End-of-Life Treatment of Sold Products
| Region | World |
|---|---|
| EF Name/Tab | Waste disposal |
| Comment | No time lag. |
| Region | US |
|---|---|
| EF Name/Tab | Scope 3 Categories 5 and 12 (Table 9) |
| Comment | Convert CH4 and N2O to CO2e and sum up with CO2. |
Category 13: Leased Assets (Downstream Activity)
Same as Scope 1 & 2 or supplier-specific data. Revisit Chapter 2, Lesson 3 for a comprehensive list of relevant emission factors.
Category 14: Franchises (Downstream Activity)
Same as Scope 1 & 2 or supplier-specific data. Revisit Chapter 2, Lesson 3 for a comprehensive list of relevant emission factors.
Category 15: Investments (Downstream Activity)
Same as Scope 1 & 2 or supplier-specific data. Revisit Chapter 2, Lesson 3 for a comprehensive list of relevant emission factors.
Activity: Finding the Most Relevant Emission Factor
Case Study: Formula Pharma Finds the Most Relevant Emission Factor

Profile: Formula Pharma is an innovative drug manufacturer in respiratory and cardiovascular disease categories (e.g., asthmatic medication, anticoagulants).
Goal: Calculate the Scope 3 Category 1: Purchased Goods and Services GHG emissions for the labels on medication packaging.
Scenario
- Formula Pharma knows they spent $700K (USD) in 2024 on medication labeling, but they checked all the emission factor databases and can’t find a “medical labels” emission factor…
Solution Process
- 1. Identify what the product is made from (e.g., paper).
- 2. Identify if there are any similar products.
- 3. Look for the closest “most relevant” emission factor.
Examples
- They look at Folding Paperboard Box Manufacturing — not correct.
- They look at Plastics and Material & Resin Manufacturing — not correct.
- Then they find Paper (except Newsprint) Mills — CORRECT.
Activity: Calculating Your Footprint
Case Study: Calculate Scope 3 emissions for Apex Medical Supply & Device Co.

Profile: Apex Medical Supply & Device Co. manufactures many items, including assorted plastic materials, namely plastic bottles, resins, and adhesives. They are an international organization with headquarters in Silverstone, UK, and offices in the US, Bahrain, Spain, and the Netherlands
Goal: Calculate the Scope 3 Category 1, Purchased Goods and Services, GHG emissions for packaging materials.
Apex Medical Supply & Device Co. is ready to calculate emissions from the total quantity of high-density polyethylene they purchase. They have several different avenues they can take to achieve this, each with a different level of quality. Walk through the example scenarios below to learn about calculating GHG emissions.
Example Scenarios

Instructions
Below are 4 scenarios that Apex encounters while developing its footprint (based on the flowchart above). Walk through each of these examples below and calculate the red boxes.
Save your answers for the end to check your accuracy.
Scenario 1: High-quality calculation approach
Using physical activity data & supplier-specific emission factors
Goal: Calculate emissions resulting from density polyethylene as a packaging material
Source: Climatiq Emission Factor
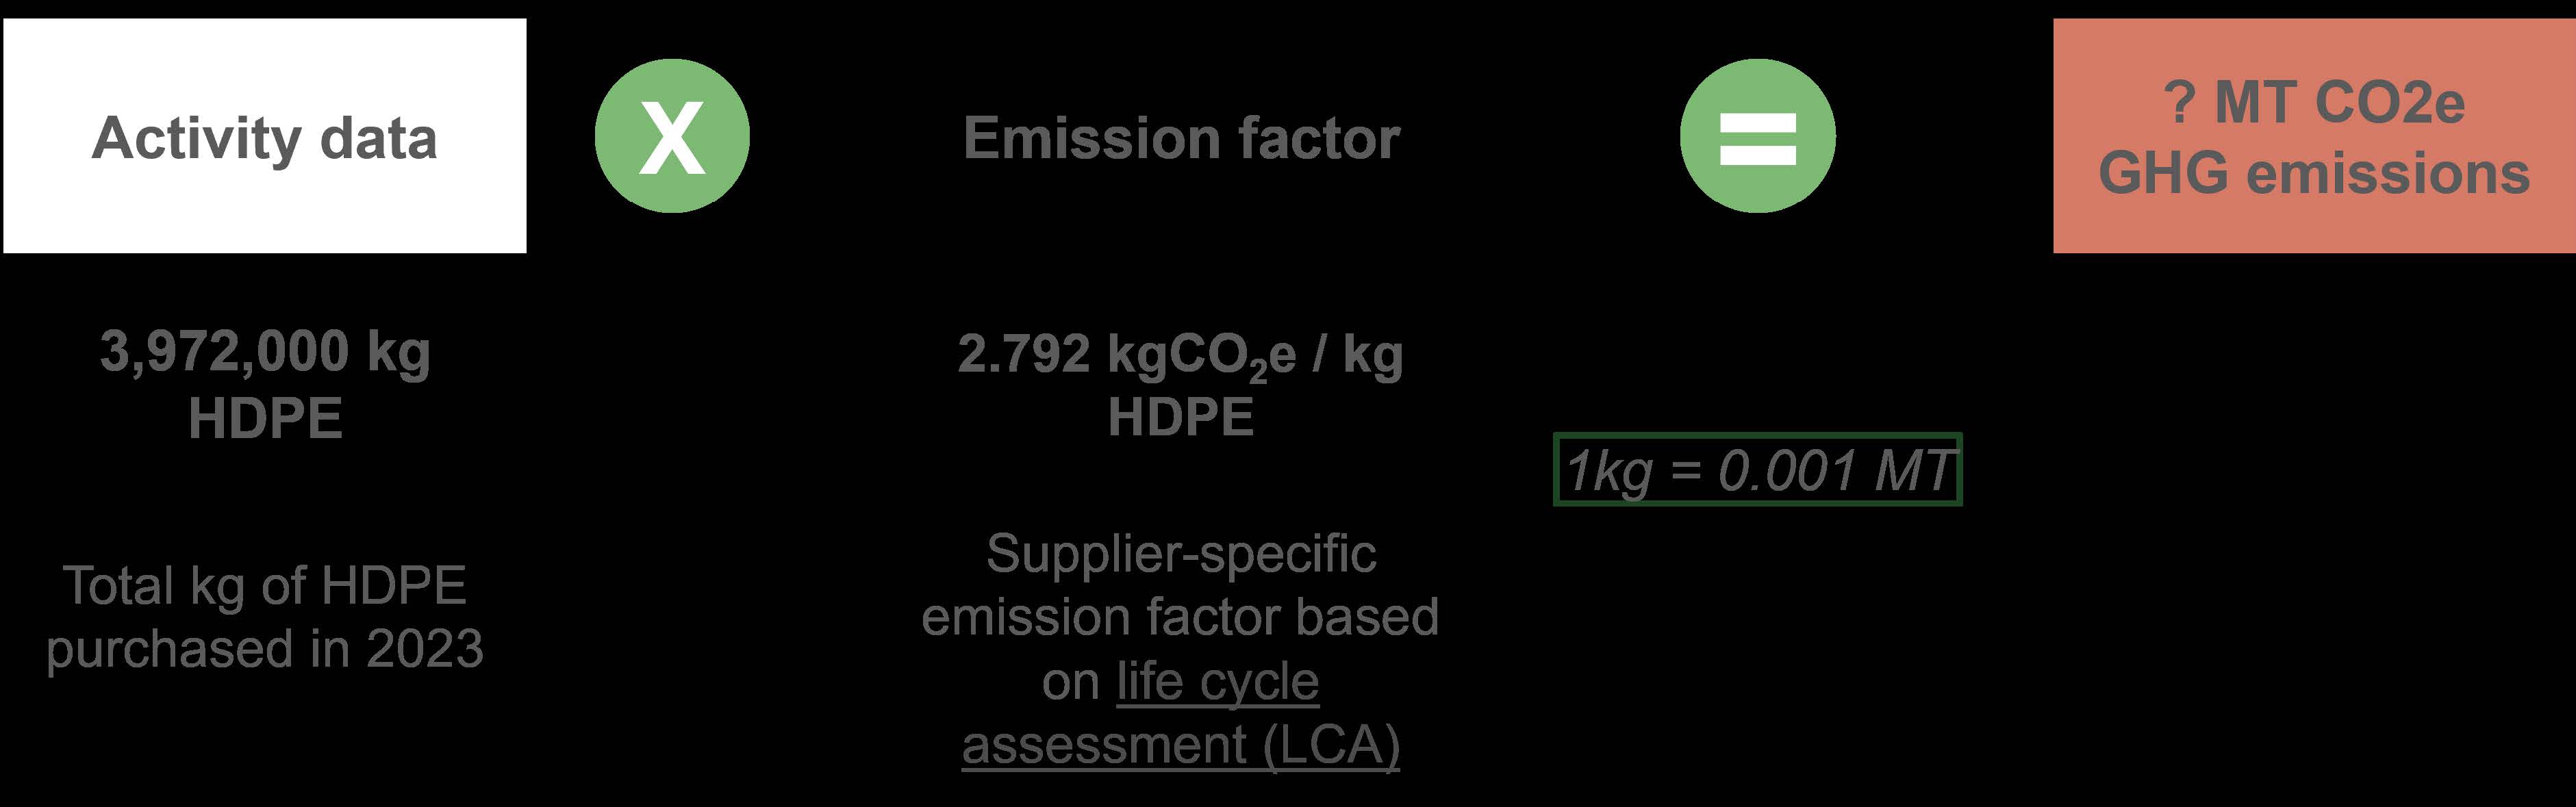
Scenario 2: Medium-quality calculation approach
Using physical activity data & secondary emission factors
Goal: Calculate emissions resulting from high-density polyethylene as a packaging material
Source: ghg-conversion-factors-2023-condensed-set-update.xlsx
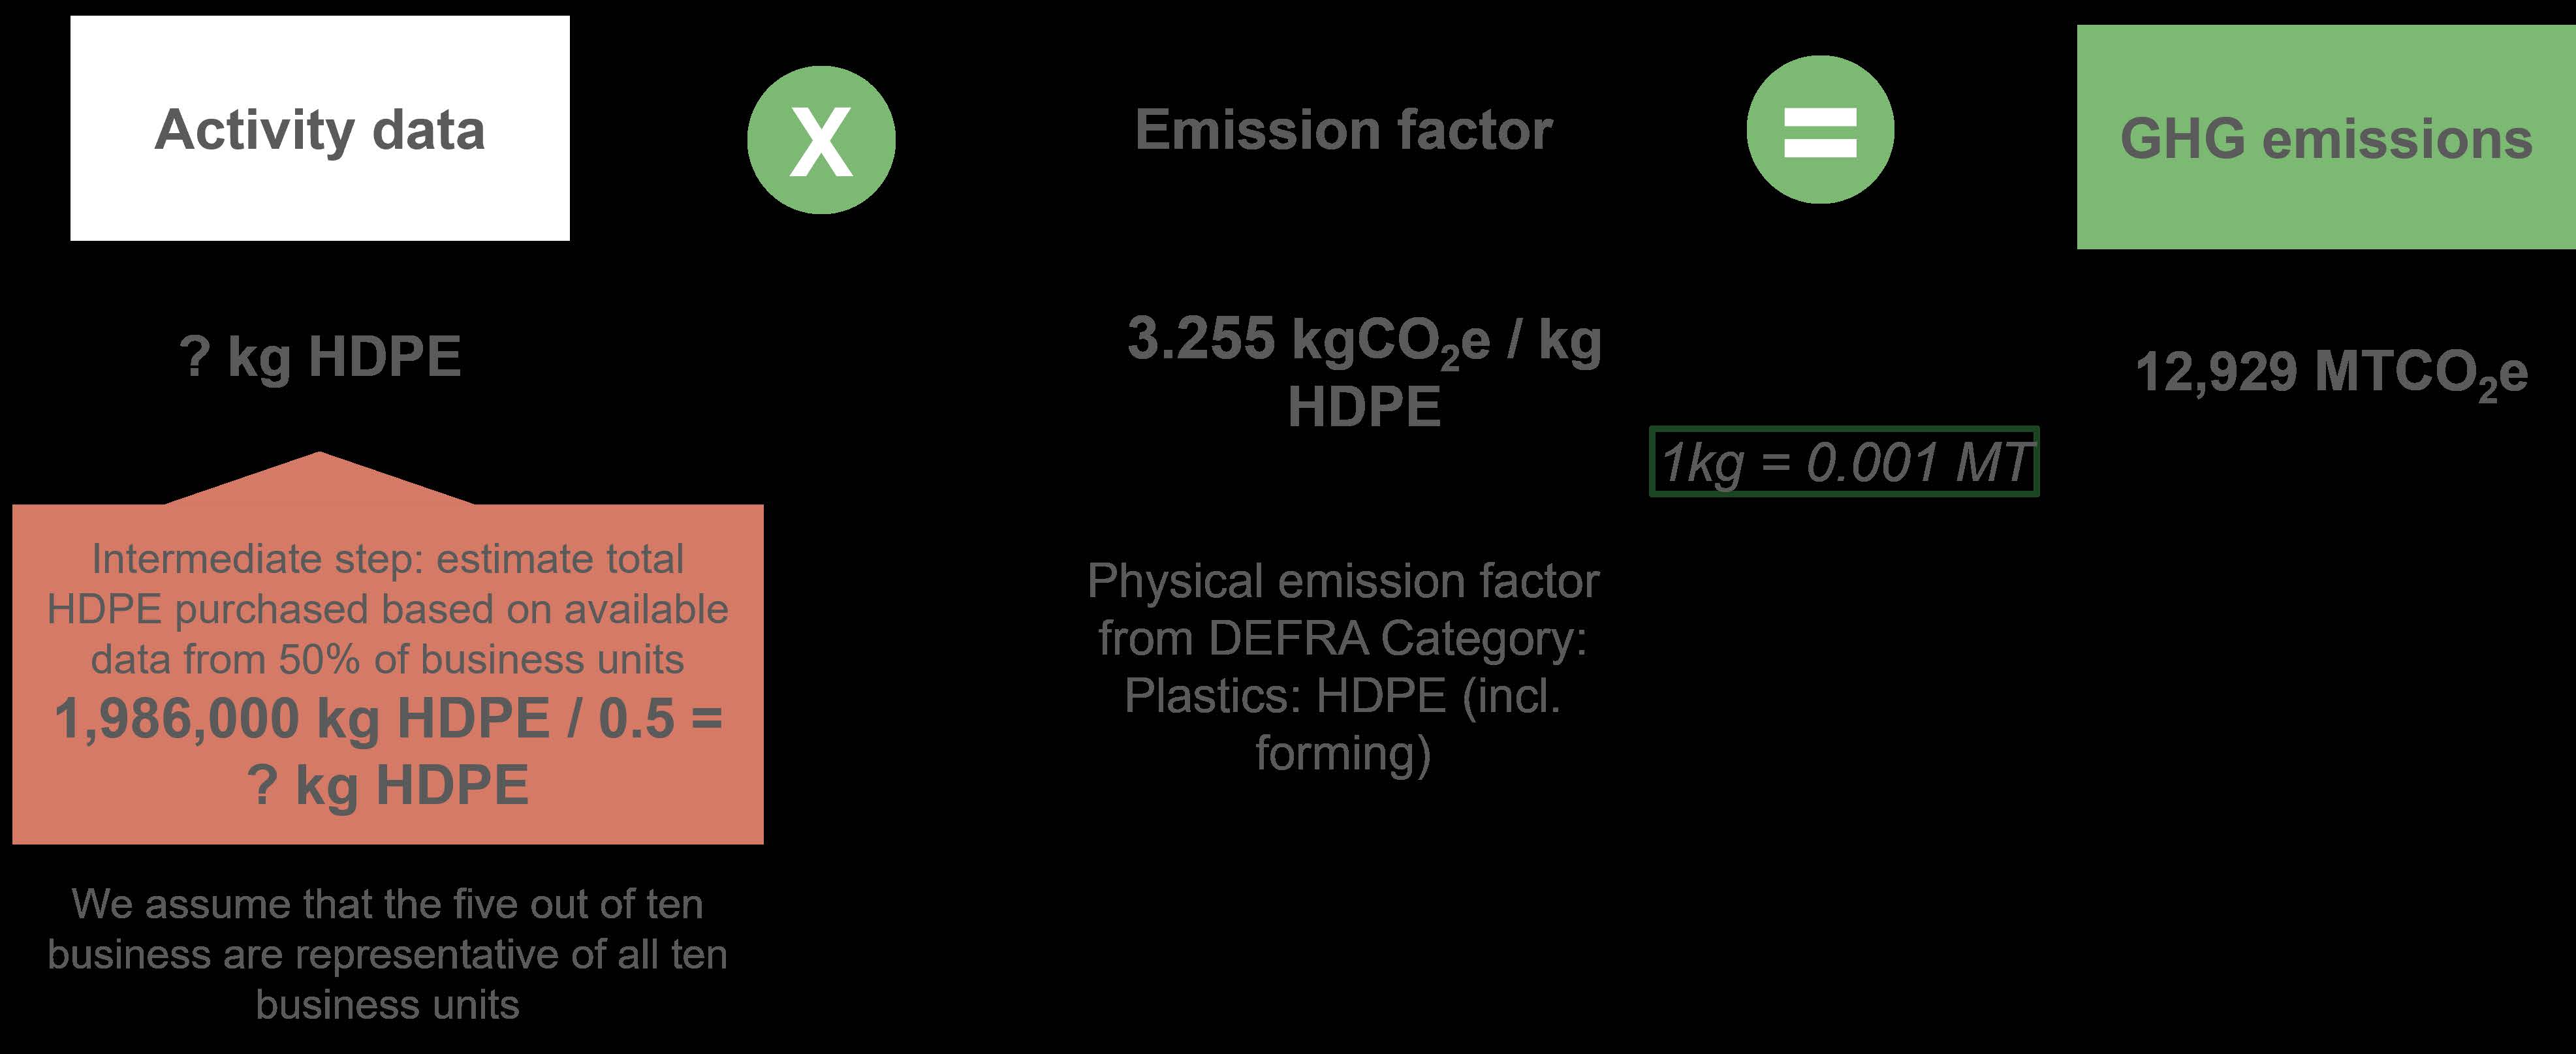
Scenario 3: Estimate calculation approach
Estimate physical activity data & use secondary emission factors
Goal: Calculate emissions resulting from high-density polyethylene as a packaging material
Source: ghg-conversion-factors-2023-condensed-set-update.xlsx
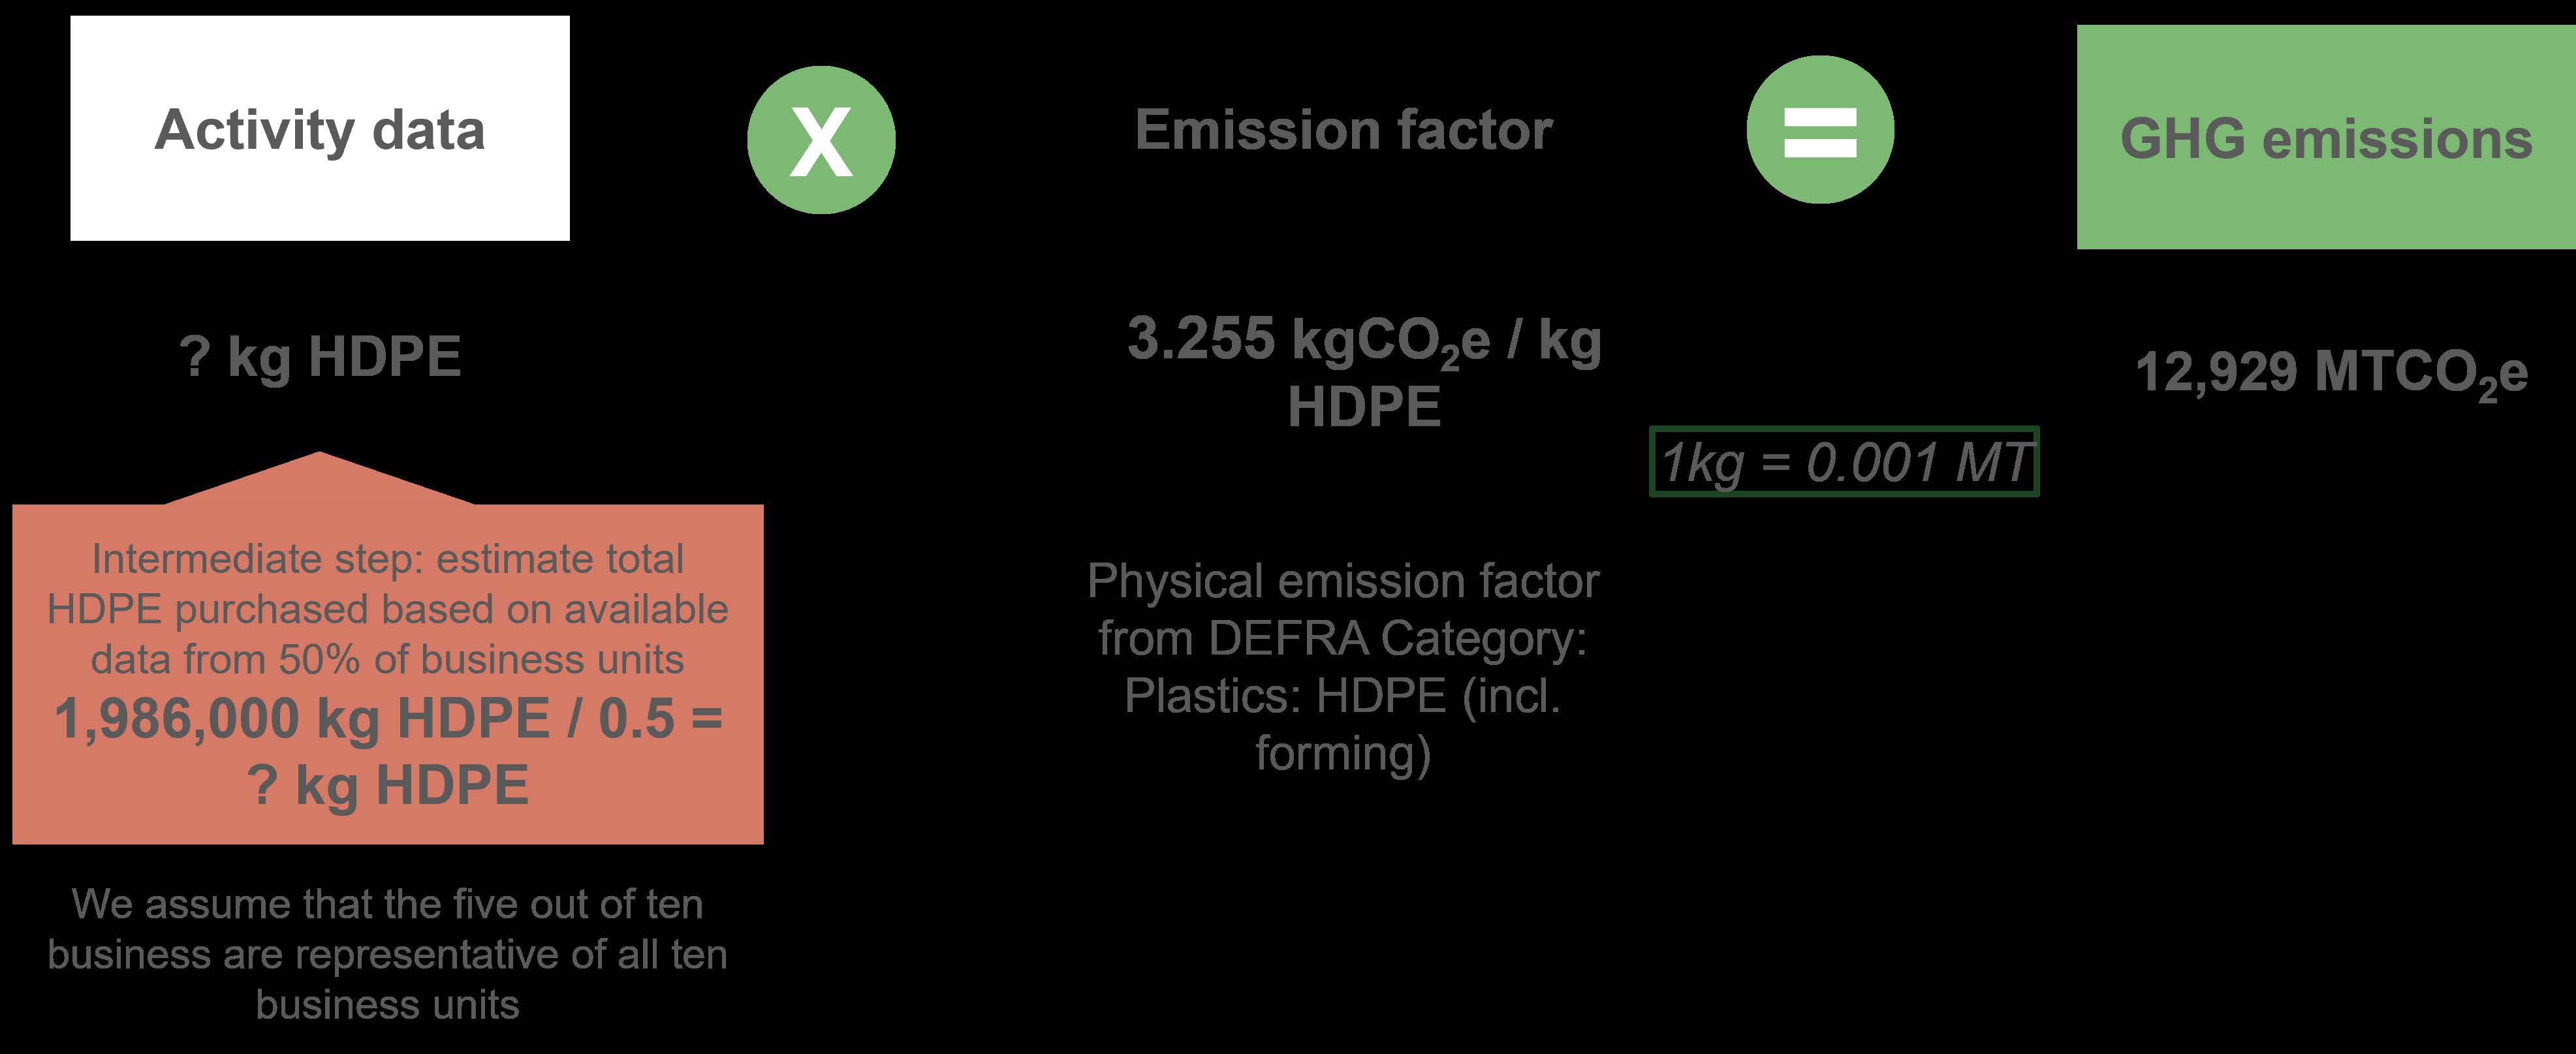
Scenario 4: Low-quality calculation approach
Using financial activity data (spend)
Goal: Calculate emissions resulting from high-density polyethylene as a packaging material
Source: Supply Chain Greenhouse Gas Emission Factors for US Industries and Commodities
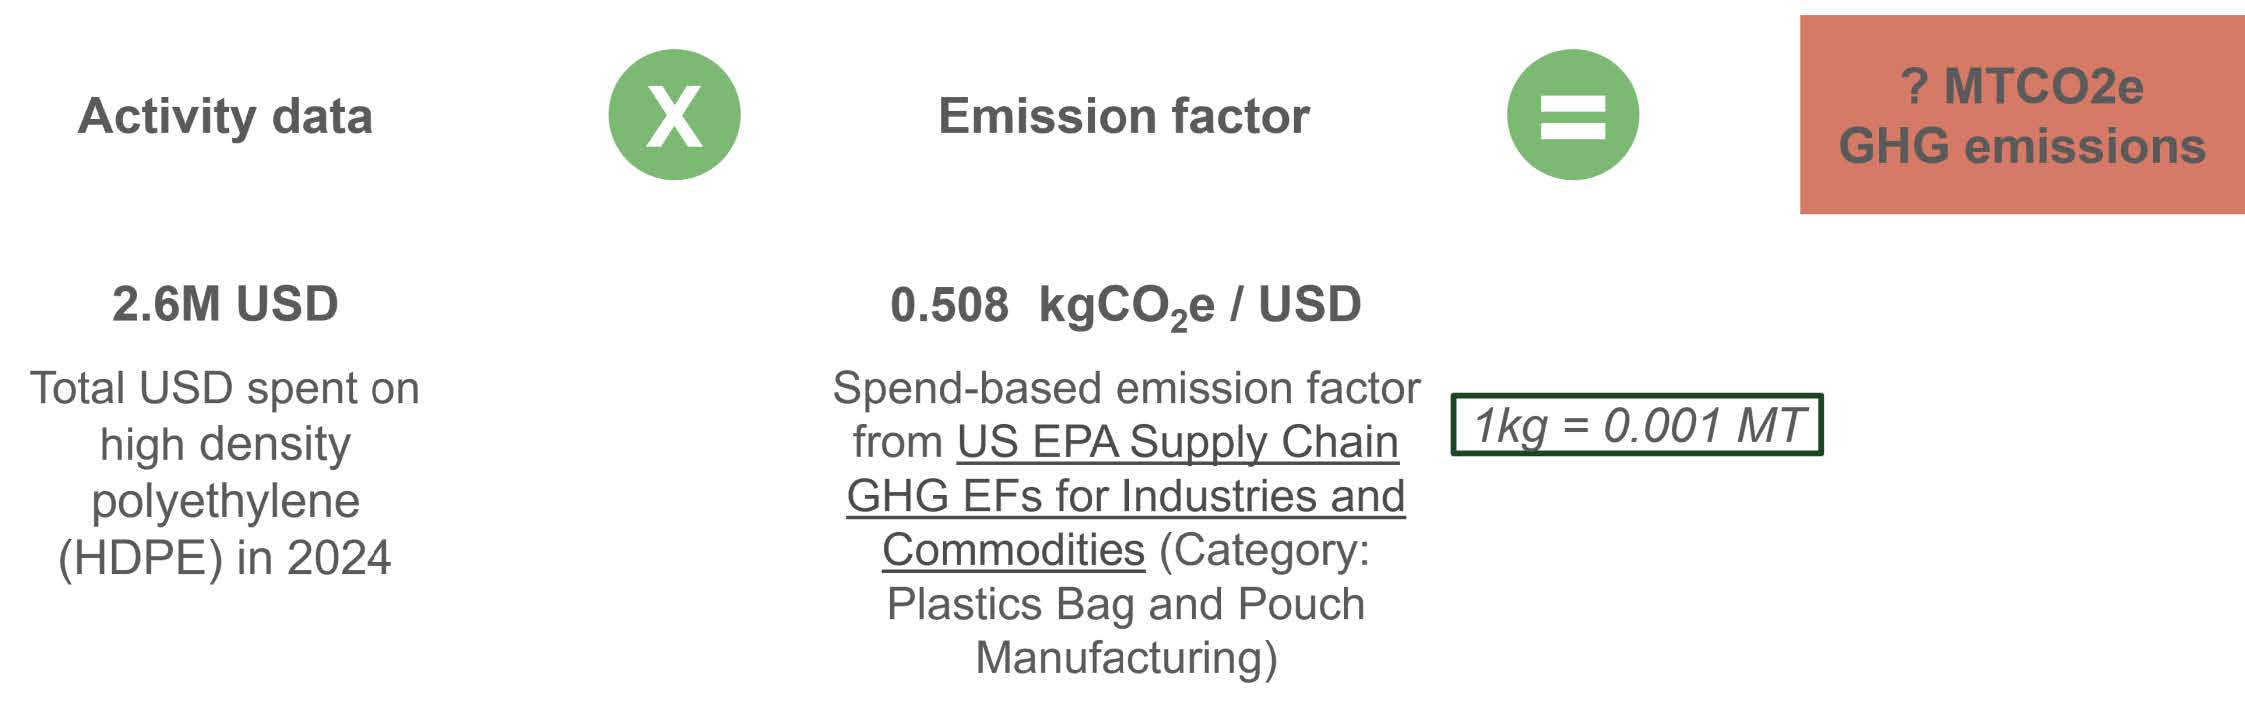
Additional Example
The physical methodology can be expanded to other categories as well!
Goal: Calculate Emissions from Ground Transport & Distribution
Important: If you are taking a weight-based approach to calculating Category 4 or 9: Upstream/Downstream T&D, it can often be tempting to aggregate all weight shipped and all miles traveled to arrive at a total ton-mileage value to apply the appropriate emission factor. However, be careful, as not all the tons shipped travel every mile of every shipment, so it is important to itemize shipments by their respective tonnage, multiply by the miles traveled of that shipment only, and then apply the appropriate emission factor for ton-mileage.
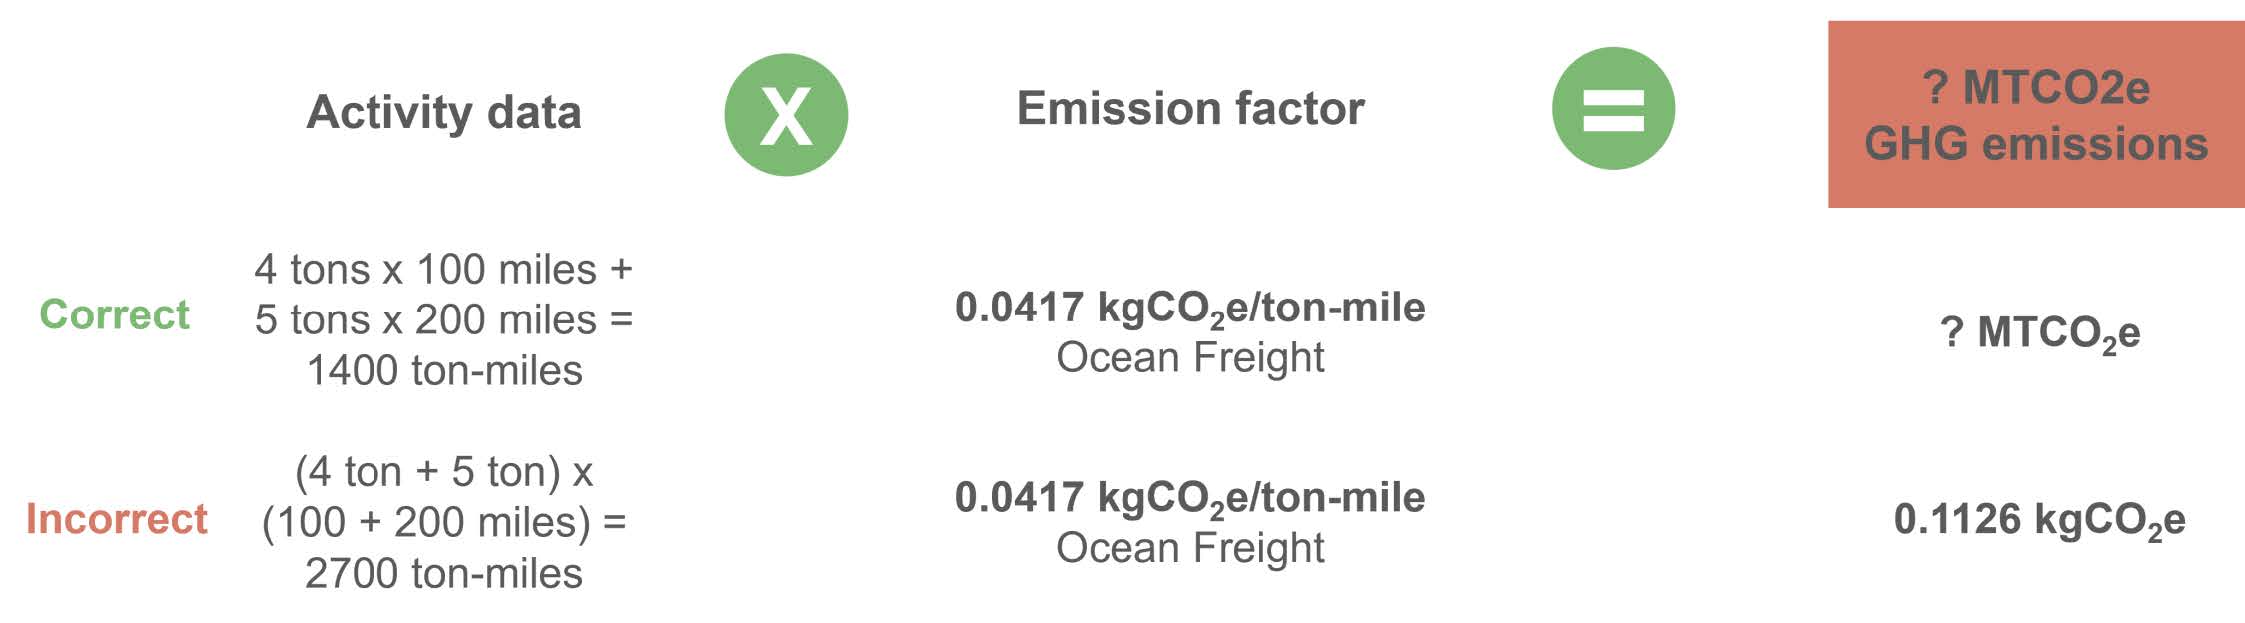
Checking Your GHG Calculations
Scenario 1: High-quality calculation approach
What are the missing GHG emissions? (Round up to the nearest whole number)
Enter your answer, then click Reveal Answer.
Scenario 2: Medium-quality calculation approach
What are the missing GHG emissions? (Round up to the nearest whole number)
Enter your answer, then click Reveal Answer.
Scenario 3: Estimate calculation approach
What is the missing activity data? (Round up to the nearest whole number)
Enter your answer, then click Reveal Answer.
Scenario 4: Low-quality calculation approach
What are the missing GHG emissions? (Round up to the nearest whole number)
Enter your answer, then click Reveal Answer.
Additional Example: Physical methodology in transportation and distribution
What are the missing GHG emissions? (Enter as decimal, round to the nearest thousandth)
Enter your answer, then click Reveal Answer.
Read: How to Set up a GHG Tool
A GHG tool has three primary components. Follow the steps outlined below and refer to the accompanying image for a visual example of each step.

Activity Data Input
To begin, organize your company’s activity data so that each activity is listed on its own line, and be sure to document any assumptions in the notes section of the same sheet to maintain clarity and transparency.

Emission Factor Input
Next, add emission factors for each activity line, and include the source of each factor to support traceability and ensure your calculations can be repeated and verified.

Calculation Output
Finally, calculate total emissions by multiplying the activity data by the corresponding emission factors, making sure to check unit consistency and perform any necessary conversions for accurate results.

Summarize Your Results with Pie Charts and Graphics
Creating bar charts and pie graphs for your Scope 3 emissions totals is a valuable step in visualizing your data, as it helps quickly identify emissions hotspots across different categories. These visuals make it easier to communicate findings to stakeholders and support decision-making around reduction strategies.
Additionally, using graphics aligns with standard reporting practices, which typically require emissions to be broken down by scope and category for transparency and consistency.
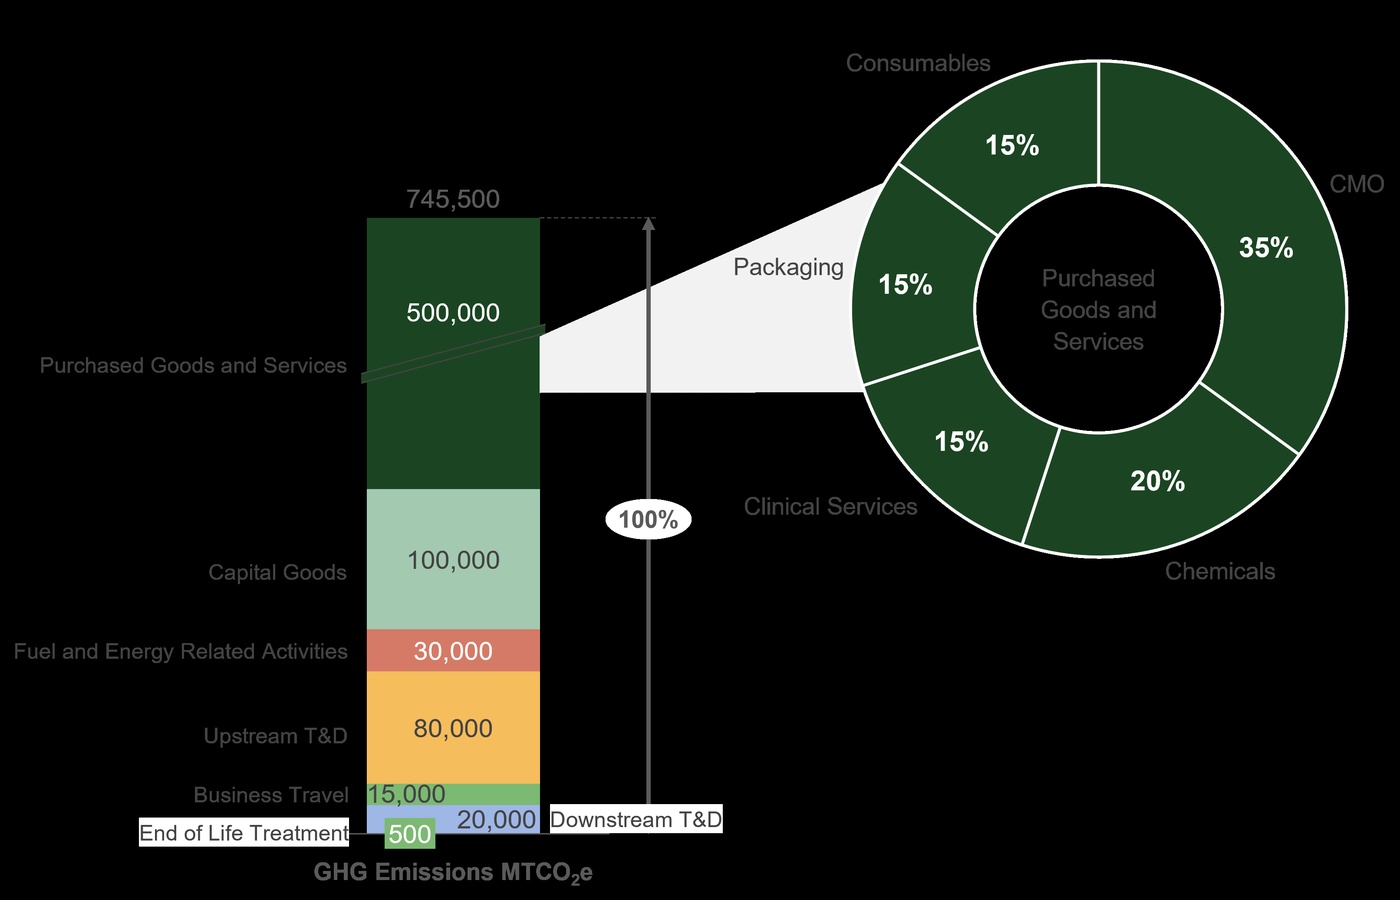
Reminder: Assessing Uncertainty and Sensitivity
Uncertainty affects Scope 3 GHG inventories similarly to Scope 1 and 2.
GHG Inventories
GHG inventories (Scope 1, 2, and 3 emissions) inherently involve uncertainties due to incomplete data, assumptions, and the complexity of emission processes. As a reminder, uncertainties can be categorized into two types: scientific or estimation uncertainty. Click through the accordion below to review the methods we use to tackle uncertainty.
Scientific Uncertainty
Limited options for action
- Scientific knowledge of emissions is evolving continuously
- Ensure use of up-to-date emission factors and global warming potential (GWP) values
Model Uncertainty
Limited options for action
- Revisit your calculation model regularly — have it e.g. externally verified
- Double-check applicability of your model when making changes e.g. to the types of inputs such as moving from estimates to measured data
Statistical Uncertainty
- Avoid systemic bias by ensuring high quality data
- Regularly check measurement systems of activity data
- Ensure use of fitting emission factors
- Cover data gaps using a robust and representative approach
Systematic Uncertainty
- Estimate statistical uncertainty
- Repeat experiments or sampling of data to detect random uncertainty
- Collect expert judgements on uncertainty
- Conduct scenario analysis
Scope 3 Uncertainty Example: Purchased Goods & Services
Organizations may enter at any stage of data certainty — some may begin with limited information, while others might already be operating at the highest data quality level. Over time, with increased experience and access to better guidance, companies can improve their certainty levels across Scope 3 categories.
The example below provides the certainty level for Purchased Goods & Services emissions and actions you can take to reduce this uncertainty.
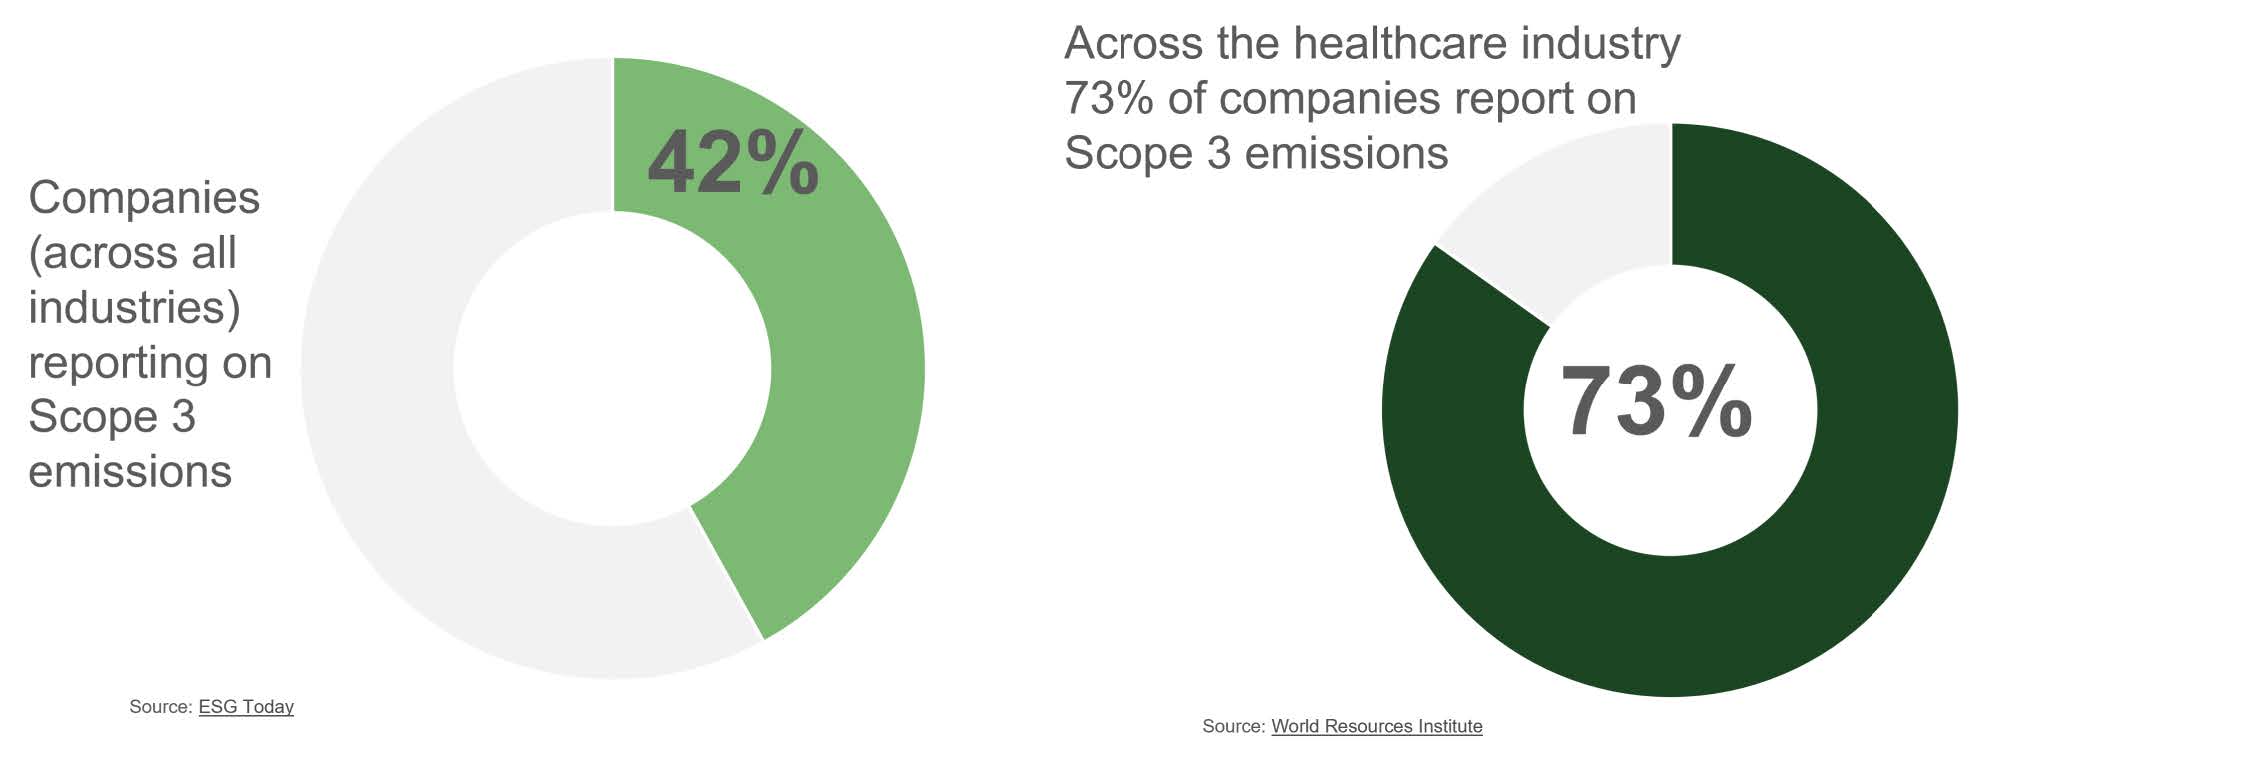
GHG Protocol Resources — Scope 3 Uncertainty
- Corporate Value Chain Accounting and Reporting Standard, Appendix B: Provides an overview of concepts and procedures for evaluating sources of uncertainty in a Scope 3 inventory
- GHG Protocol Uncertainty Tool: Tool to assess individual uncertainty per emissions source
- GHG Protocol Uncertainty Calculation Guidance: Helpful document with background information on uncertainty calculations
Watch: Dealing with Data Gaps in Scope 3
Filling data gaps in Scope 3 emissions uses similar methods as Scope 1 and 2, but the broader range of categories in Scope 3 often requires more data sources and additional research.
Watch the video below to see example gap-filling sources.
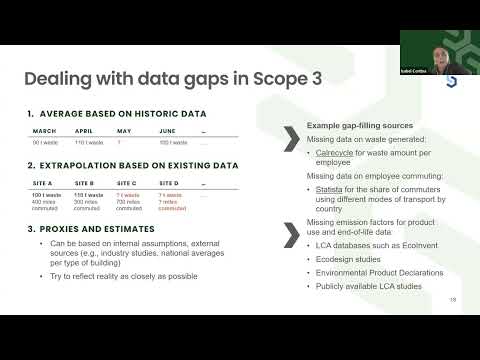
Remember Scope 3 Emissions Can Account for up to 95% of a Company's Footprint
We understand that calculating Scope 3 emissions can feel overwhelming, but it's a critical part of your overall greenhouse gas footprint. In many cases, Scope 3 can represent the majority of an organization’s emissions — sometimes up to 95%. Tracking these emissions is essential because ultimately, you can’t reduce what you don’t measure.
Reference: Scope 3 Calculation Tools and Resources
Wrap up: Lesson 3.3
Lesson recap
Determining Emission Factors
- In this lesson, we covered how to identify the type of emission factors needed to calculate GHG emissions with corresponding activity data. Like activity data, there are primary and secondary emission factors. The goal is to use the most accurate emission factors possible: 1) Physical primary / supplier-specific 2) Physical global / regional 3) Spend.
Calculating Footprints
We walked through a few example scenarios for calculating parts of a footprint.
The key concept: Activity data × Emission factor = GHG emissions
Always remember to convert properly into your final metric (MT CO2e).
Assessing Uncertainty and Sensitivity
There are several types of uncertainty that impact GHG inventories. Manage uncertainty by attaining better data, working with your footprinting team, and building consistency into your footprinting practices to achieve best-in-class data.
Track Progress and Data Maturity
In this lesson, we will be covering everything you need to know about monitoring, reporting, and verifying your footprint, both internally and externally. We will also discuss how to improve the accuracy and impact of your footprint over time and make progress in emissions reduction.

What you will learn
- Understand the different types of reporting.
- Learn how to monitor and report your footprint internally.
- Learn how to verify and report your footprint externally.
- Discover how to improve the accuracy and impact of your footprint over time.
- Understand how better footprints contribute to emissions reduction progress.
This figure shows the Chapter 3 Overview. Lesson 3.4 focuses on how to track progress and reach data maturity.
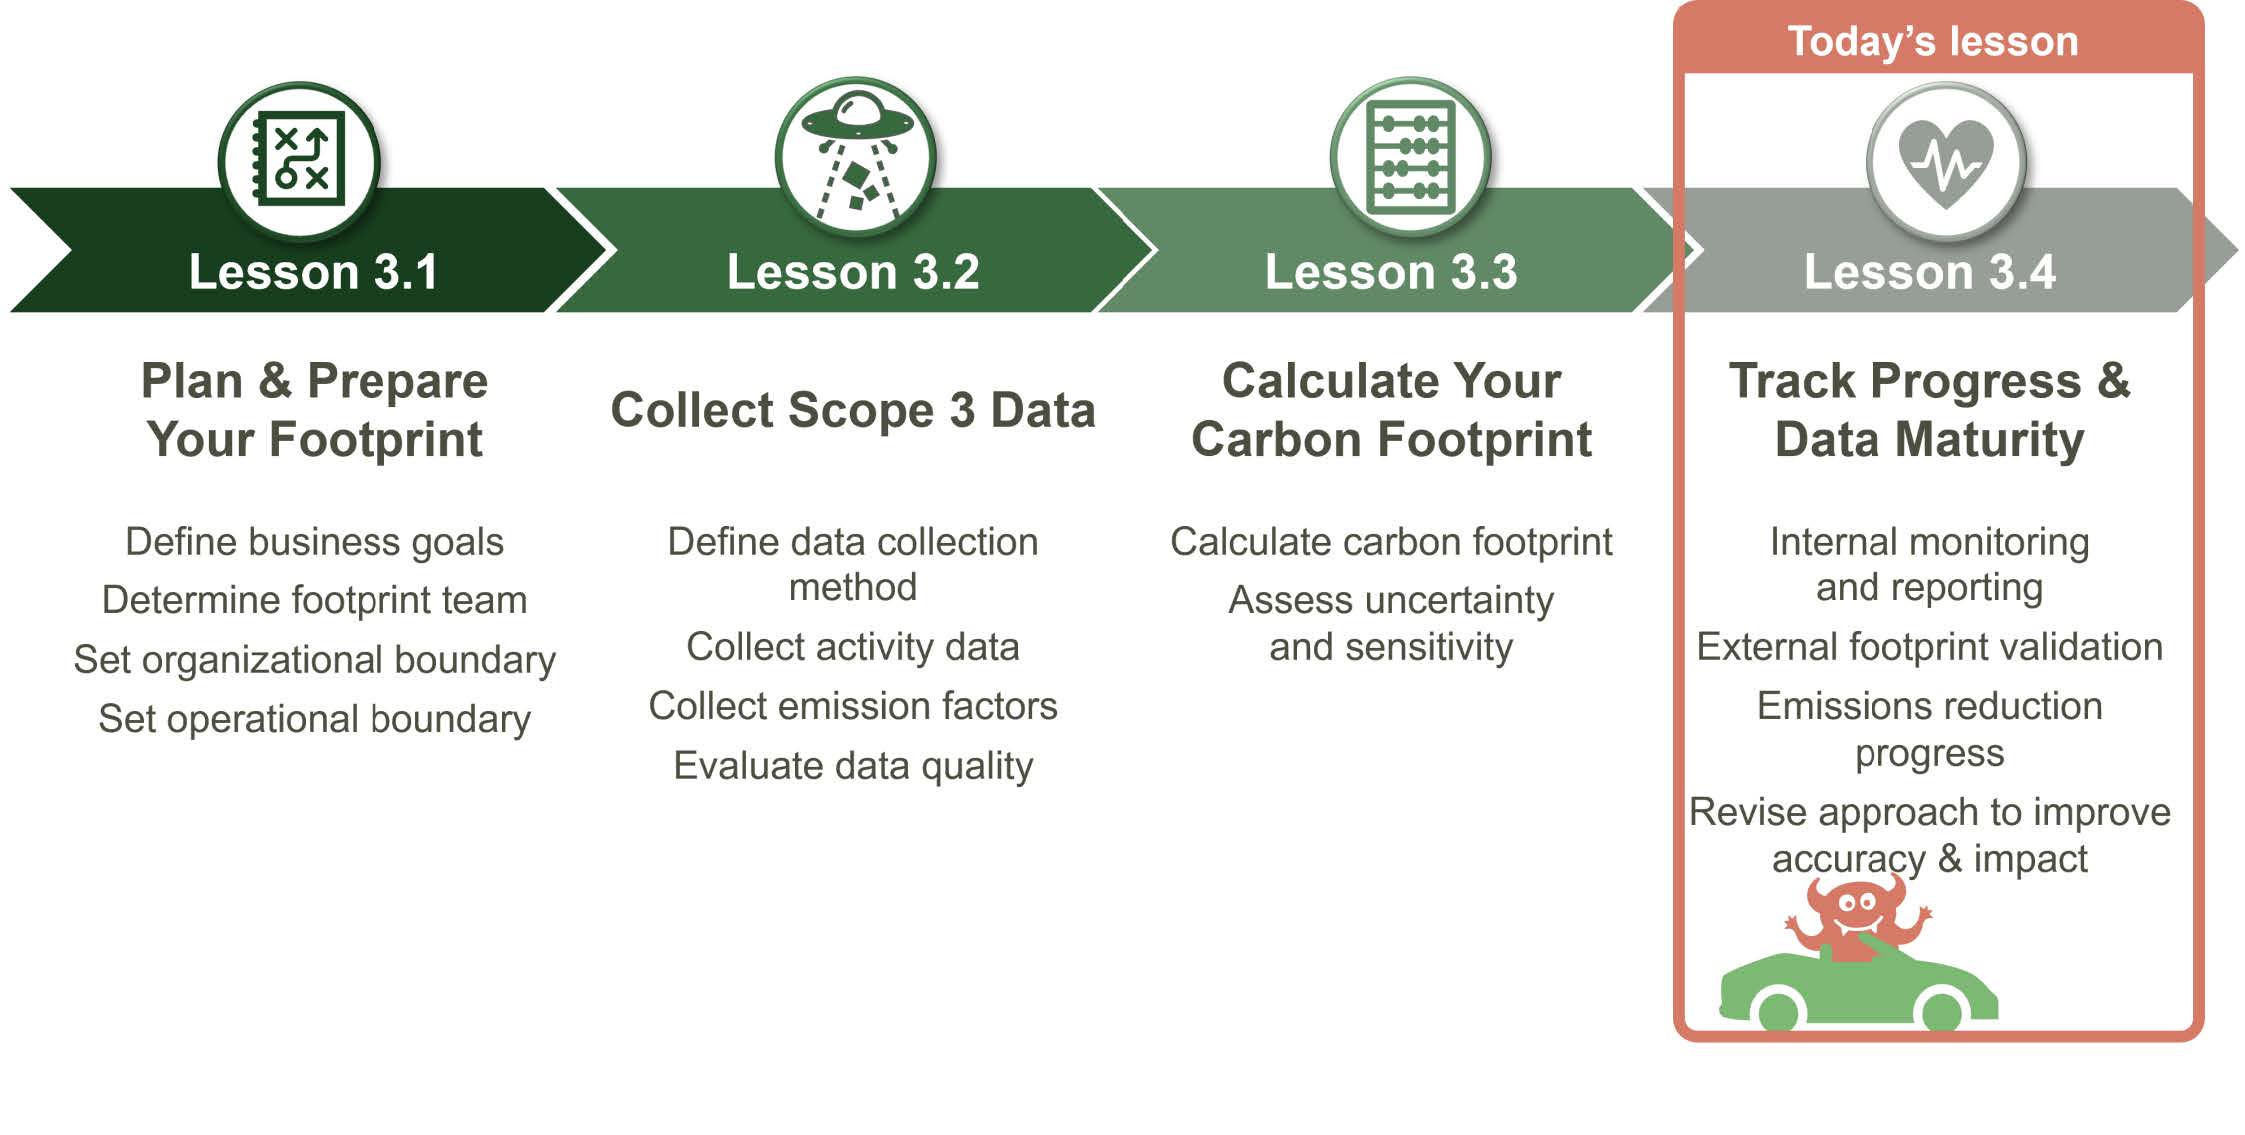
Read: Types of Reporting
Benefits of External Footprint Reporting
- External awareness and visibility (e.g., publishing on company website)
- Appease stakeholder, customer, and/or investor expectations (e.g., Walmart Project Gigaton)
- Adherence to regulations and mandatory reporting requirements (e.g., CSRD, SEC)
- Completion of sustainability or CSR reporting
- Reporting aligned with ESG disclosure frameworks (e.g., GRI, SASB, CDP, DJSI, ISSB)
- Voluntary reporting to different GHG programs (e.g., US EPA Climate Leaders, EU GHG Emissions Allowance Trading Scheme)
Benefits of Internal Footprint Reporting
- Improved understanding of company operations and opportunities for greater efficiency and decarbonization, resulting in reduced costs and waste
- Reduced risk of non-compliance with local or regional regulations, such as environmental audits
- Meet leadership/board ESG goals
- Attract and retain eco-conscious employees
- Demonstrate climate performance relative to peers and competitors
Internal and External Reporting
There are two types of reporting for your GHG footprint: internal and external. Internal reporting ensures that relevant company leadership is aware of your GHG impact, while external reporting is how you disclose to the public your impact on emissions. Reporting your footprint internally and externally acknowledges the work that your team has done, as well as setting your company up for emissions reduction success in the future.
Assessing Uncertainty and Sensitivity
There are several types of uncertainty that impact GHG inventories. Manage uncertainty by attaining better data, working with your footprinting team, and building consistency into your footprinting practices to achieve best-in-class data.
Verifying Your Footprint Ensures Quality and Consistency
Verifying the data and calculations for your footprint is one of the most important aspects of the process, as it ensures your footprint accurately reflects your business and catches large errors. These processes also set you up for success in future footprints. Everyone should at least go through an internal verification, or “QC,” once it’s complete. Ideally, parts of this would have occurred during the calculation process, but it’s best to have it double-checked by someone external to the calculations, as they can often catch additional small mistakes or calculation errors. Then you may conduct an external verification, which is especially useful for companies that are not confident in their methodologies/results or have complex calculations or operations.
External (Third-Party) Footprint Verification
An organization independent of the Scope 3 inventory process conducts external verification (e.g., consulting and auditing firms that specialize in footprints).
Key Considerations: Offers a higher degree of objectivity and independence. Threats to independence (financial and other conflicts of interest between the reporting company and the external verification company) should be assessed during the assurance process.
Internal (First-Party) Footprint Verification
Person(s) within the reporting company conduct the internal verification.
Key Considerations: Preferably, the person(s) should be independent of the GHG inventory process; worthwhile learning experience for a company prior to commissioning external verification.
External GHG Emissions Reports Should Include the Following:
| Required Information | Optional Information |
|---|---|
|
|
| Companies should aim to include the above information in accordance with the GHG Protocol Corporate Standards | |
Reporting & Rating Agency Resources
For standardizing the reporting and disclosure of ESG metrics:
- SASB — Sustainability Accounting Standards Board
- GRI — Global Reporting Initiative
- CDP
- IFRS — IFRS Foundation
- EU CSRD — Corporate Sustainability Reporting Directive
- Dow Jones Sustainability Indexes — S&P Global Sustainable1
For developing scores based on performance across material issues, including the environment:
Quiz
Formula Pharma just finished their first Scope 3 footprint two months past their internal deadline after struggling through frequent data availability and quality issues. Their chief sustainability officer is pressuring the team to include the results in their latest corporate sustainability report by the end of the month.Should Formula Pharma externally verify their footprint?
Select one answer.
Watch: Internal Monitoring and Reporting
Reminder: Footprints Should Be Verified in Alignment with GHG Protocol Principles
You may remember from some of our past lessons these five basic principles of the GHG Protocol. As you may also recall, the GHG Protocol serves as the framework and standard for conducting your footprint, and you would want your footprint to be aligned with these principles of relevance, completeness, consistency, transparency, and accuracy.
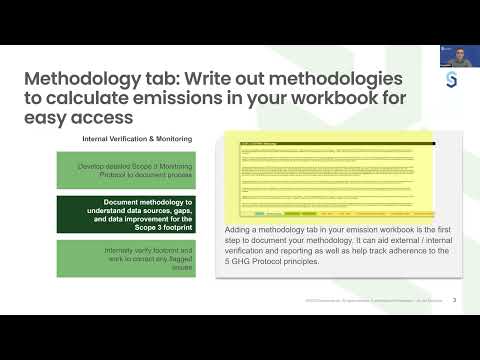
Read: Exacting Organizational Change
Learn How to Exact Organizational Change
Once you have completed your footprint, you can utilize the information to exact organizational change. Understanding and reporting your GHG emissions will help your company reduce risk by:
- Isolating emission hotspots in your supply chain
- Identifying resource and energy risks in your supply chain
- Avoiding expensive emission offsets and carbon taxes
It may also help you identify opportunities like:
- Determining new markets and products
- Engaging the supply chain in GHG management
- Improving the energy efficiency of products
Activity: Testing Your Knowledge on Monitoring Protocols
Monitoring Protocol Completion
After finishing their first Scope 3 footprint, Apex executives are quickly pushing their footprint team to work on another important sustainability initiative. Apex has internally verified their results and created a methodology sheet in their Scope 3 Excel workbook. However, they have not created a GHG monitoring protocol summarizing their work. Should the footprint team wait to work on the other sustainability initiative until their monitoring protocol is complete?
Select one answer, then click Reveal Answer.
Read: External Footprint Verification and Reporting
Verifying Results via External Consulting and Auditing Firms
As your footprint grows in maturity, external verification is helpful to confirm best practices and spot any inconsistencies with calculations, especially for companies with less experience in emission footprinting or those whose footprints are complex.
Reporting and Rating Agencies
Standards help companies report on Environmental, Social, and Governance, or ESG, metrics. Rating agencies are private organizations that provide scores and ratings to companies based on their ESG impacts, which investors and stakeholders use to rate the investment potential or performance of a company.
Below are some of the ratings and external reporting agencies that create these standards. There are hyperlinks in the text so you can click on each to learn more.
Watch: Emissions Reduction Progress
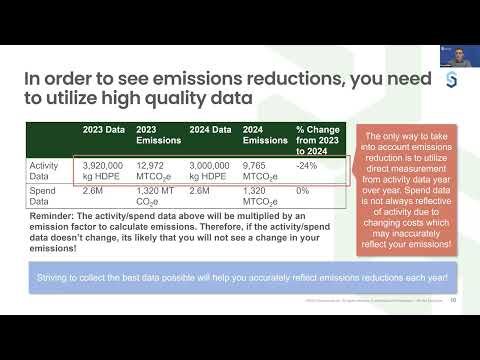
It’s therefore a good practice to reference these principles as you move through your internal verification and quality assurance. Many times, judgment calls will have to be made in terms of selecting proxies, making estimates, and deciding on which approaches to take in your footprint based on how they best align with these principles.
In other words, these principles are your guiding principles for the internal work you are doing on your footprint.
| Description | Example | ||
|---|---|---|---|
| 1 | Relevance | GHG inventory must contain all the relevant information that is required for decision-making. | A drug manufacturing company with a large amount of refrigeration requirements makes sure to report on all the potential refrigerant emissions. |
| 2 | Completeness | GHG inventory must have complete information regarding emission sources and activities within the selected boundary. | The drug manufacturing company includes data for all its facilities around the world. |
| 3 | Consistency | Use consistent methodologies to allow for meaningful comparisons of emissions over time. | The same methodology is used to calculate the emissions for fuel use and electricity year over year. |
| 4 | Transparency | Disclose assumptions clearly, factually, and neutrally by maintaining proper documentation. | The data used to calculate the electricity, fuel use, and refrigerant emissions is well-documented. |
| 5 | Accuracy | Maintain accuracy and reduce uncertainty while calculating emissions for proper decision-making. | The company uses country-specific data for electricity grid emissions to calculate electricity emissions in different parts of the world. |
Deep Dive: CDP
Let's Take a Deeper Look at One of the Key Reporting and Rating Agencies: CDP!
CDP is one of the most widely utilized voluntary global environmental disclosure frameworks. Many investors and stakeholders will use the results of CDP to drive additional change to improve their processes or reward high performance. Meanwhile, companies will provide data on their environmental impacts, risks, and opportunities to showcase their effort in the area. Based on both of these, companies will take actions to improve their environmental performance, such as pursuing abatement measures, reducing their environmental impact, or increasing sustainability initiatives.
The overall goal of CDP is to create transparency on where a company stands and what actions are being taken.
Read: Improving Accuracy and Impact
Refining Your Footprint
Once you have verified your footprint, you can implement improvements within your process to improve the overall accuracy. This can take place at the three key parts of the calculations: the calculation methodology, activity data, and the emission factors. Revising is one step in the GHG footprint life cycle, and an important step prior to preparing to calculate your next footprint iteration.
Improve Accuracy of the Calculation Method
Many of you have likely used a combination of calculation and estimation to calculate your footprint this year. As you increase your footprint maturity, you should aim to move higher on this accuracy scale. First, this will look like using a majority of calculations over estimation. This will require a majority of primary activity data, which could take a few years and iterations of your footprint to achieve, especially as supply chain activities are harder to track.
Direct measurement through direct GHG monitoring is for very sophisticated footprints, but you can start to reach this by engaging more heavily with your suppliers to track their emissions. You may have used proxy data in your current footprint — while this is acceptable, especially during your first iteration, this is a prime and easy thing to identify and focus on improving in the following years. As you can see from the graphic below, ideally, you will move on from the use of proxy data to secondary data to fill your gaps, with the ultimate goal of no gap-filling required due to having complete primary data.
| Approach | Description | Pros | Cons |
|---|---|---|---|
| Direct measurement (most accurate) | Emissions are measured using direct monitoring of a GHG, mass balance, or stoichiometry | High accuracy and consistency | Difficult or impossible to directly measure emissions from many activities |
| Calculation | GHG emissions are calculated by multiplying primary measured activity data by an emission factor | Potential for good accuracy, transparency, and consistency | Quality is highly dependent on the quality of the primary activity data and emission factors |
| Estimation (least accurate) | GHG emissions are estimated by multiplying secondary or industry average activity data by an emission factor | A simple substitute when primary data is not available | Lower accuracy than other methods |
Review Your Data Against the Five Activity Data Quality Indicators Defined by the GHG Protocol
- Technological relevance: The degree to which the data reflects the actual technology used.
- Temporal relevance: The degree to which the data reflects the actual time or age of the activity.
- Geographical relevance: The degree to which the data reflects the actual location of the activity (e.g., the country or state).
- Completeness: The percentage of locations and time for which data is available and used, with reference to a particular activity.
- Reliability: The degree to which the sources, data collection methods, and verification procedures are dependable.
Activity: Evaluating Scope 3 Emissions Results
Reviewing Scope 3 Emissions
Formula Pharma collected all its relevant data and then reviewed the data to ensure it was accurate and of good quality. Which of the following is an indication of bad data?
Select one answer, then click Reveal Answer.
Engaging Suppliers on Data Quality
One of Apex's suppliers says they don't have the time or people available to calculate their emissions or provide the requested activity data, but they are Apex's largest provider of plastic. How would you respond?
Write your response below.
Companies have various methods for dealing with a situation like this. If resources are available at the corporate level, you might be able to assist the supplier in hiring a firm to help calculate their data. You can provide funds for them to hire internally as well. Or, you might decide to wait until they have resources. Ultimately, it is up to your company.
Read: Choosing Better Emission Factors
Choose Emission Factors Based on Their Associated Characteristics
To improve the accuracy of your calculations, you should also evaluate the relevance of your emissions factors for the associated characteristics:
- Geography: Emission factors can be specific to a city, country, or region, or globally applicable. Choose the best available to match the region your activity data is in.
- Technology/Process or Product: Emission factors will differ based on the specifics of the underlying activity. Finding the closest commodity emission factor to match what you buy will be of utmost importance.
- Year: Many databases re-calculate emission factors to incorporate updated methodologies or data on an annual basis. Keep your emission factors updated year-to-year.
- Scope: Emission factors can differ in the parts of an activity or product life cycle that they represent. Ensure you are using emission factors for the correct boundary.
Example: Formula Pharma Accuracy Improvement (2024 to 2025)
| Year 2024 | Year 2025 | |
|---|---|---|
| Calculation methodology | GHG emissions were estimated by multiplying secondary activity data by the emission factor. Estimation approach. | GHG emissions are calculated by multiplying primary measured activity data by an emission factor. Calculation approach. |
| Activity data | Spend data on fuel consumption was collected using secondary sources. Financial activity data. | Annual fuel consumption by fuel type and vehicle type is collected from a third party's database. Physical activity data. |
| Emission factor | A spend-based monetary emission factor from Exiobase was used. Financial emission factor. | Physical emission factor from the EPA is used. Physical emission factor. |
Read: Emissions Reduction Progress
Tracking and Reporting Progress on Your Targets
The goal of preparing a greenhouse gas footprint is to measure your contribution to global GHG emissions. While the preparation of your footprint is an important step, it is only the first step. From there, you now need to perform regular checks to measure your progress in reducing your emissions, usually in line with an emission reduction target, and also report on this progress.
Once an emission reduction target has been set, it is necessary to track progress to reduce emissions in a consistent, complete manner:
- Link the annual GHG inventory process to the emission reduction target and carry out regular emissions checks in relation to the target
- Report emissions from sources inside the target boundary
- Report internal project reductions sold/transferred to another company
- Report overall performance in relation to the target
Setting a Formal GHG Reduction Target
Below is an example of setting a formal greenhouse gas reduction target for Apex Medical Supply & Device Company, where Apex has committed to reducing its Scope 3 emissions 50% by 2030 and to achieving Net Zero by 2050 from a 2023 base year.
Wrap up: Lesson 3.4
Lesson recap
Stakeholder Engagement and Alignment
- Assess abatement potential
- Engage with stakeholders on targets
- Build a business case
Leadership Buy-in
Build the storyline around your targets by answering questions about “why,” “what,” “how and how much,” and “who?” Bring together your abatement potential, key stakeholders, and business case into a leadership level discussion.
REMINDER: It is good to bring your leaders in earlier in the process to give them time to get comfortable with the targets!
NAM Climate Journey Stage 5
Through your target setting process, strive to continuously improve your practices around reducing GHG emissions.
Tools and Resources
Recommended Tools & Resources
Target Setting
Introduction to Target Setting

What you will learn
- Understand the different types of science-based targets.
- Learn the principles of target setting.
- Introduce the target setting process.
This figure shows the Chapter 4 Overview. Lesson 4.1 focuses on the value of science-based targets and introduces the target setting process.
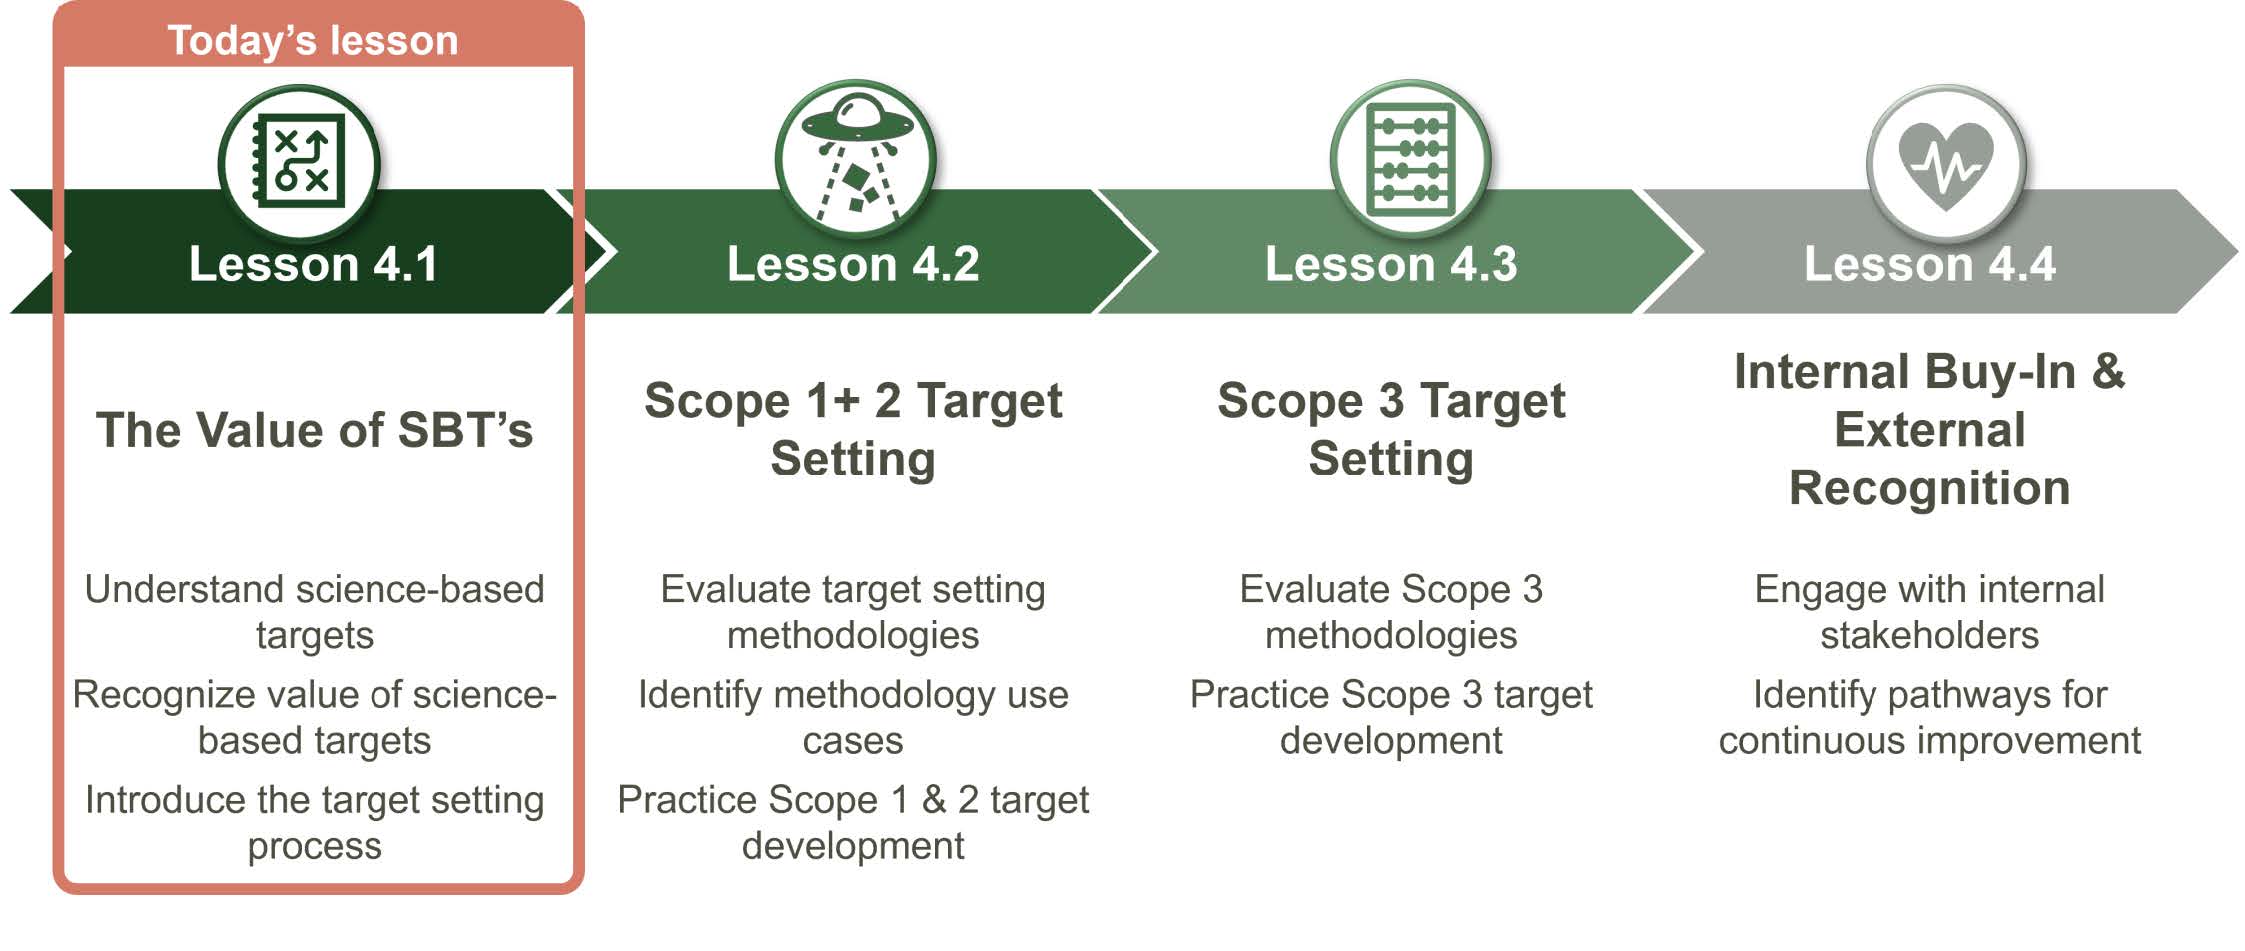
Reminder: NAM Climate Journey Stage 2
In Lesson 1.1, we learned about Stage 2 of NAM's Climate Journey: Governance and Organizational Planning.
Read below as a refresher!
This second Stage of Governance and Organization Planning builds directly on Stage 1 by translating regulatory awareness into internal action and accountability. Once you have a general understanding of what is required of your company, you must establish internal structures to meet those requirements effectively.
Critical steps for successful Governance and Organization Planning include:
- Leadership commitment
- Advocating for a governance plan that outlines clear steps for identifying emissions
- Establishing decarbonization targets
- Choosing appropriate metrics and standards
- Ensuring strategic alignment with the business to foster sustainable practices across the organization
By adopting these measures, organizations can seamlessly integrate sustainability into their operations, maintain accountability, promote equity, forge partnerships, and strengthen resilience.
Actions
To create effective governance frameworks and integrate sustainability into your organization's operations, follow the steps outlined below.
- Make the case to leadership. Key elements of the case might include return on investment (ROI), business strategy, key performance indicators (KPIs), operational resilience, reputational impacts, customer/shareholder perspective, competitive advantage, cost savings, community benefits, and health equity.
- Propose a carbon emissions governance plan. This plan should include the creation of decarbonization objectives, accountability measures, reporting structures, governance processes, performance metrics, and a timeline/transition strategy.
- Assess potential partnerships and collaborations. Such as more efficient energy sources, use of AI and other tools to reduce carbon footprint, regional infrastructure improvements, development of a systematic way to use data systems and analytics to measure and manage progress.
- Assess the impact of environmental risk factors and implications for health equity. Develop an agenda/plan that infuses equity and community engagement to address the health disparities exacerbated by environmental risk factors.
- Consider transparency/reporting. Such as scoping for own ESG reports.
- Select metrics and reporting standards. Such as Scopes 1–3 (e.g., Greenhouse Gas Protocol, CDP, GRI, SASB, TCFD); Establish a baseline; Resilience assessments of own operations and most significant suppliers.
- Develop climate response plans. Plans that support employee health and availability, including transportation, food, emergency shelter, generators, etc.
Potential Challenges
You may likely encounter challenges while you implement sustainability into your organization's planning. Some of these challenges may include:
- Leadership buy-in: Gaining leadership commitment and support for sustainability initiatives may require overcoming skepticism or competing priorities.
- Role clarity and capacity: Clearly defining roles and responsibilities for sustainability and ensuring adequate resources and capacity can be challenging.
- Cultural shift: Nurturing a sustainability-focused culture may require changing mindsets, behaviors, and practices within the organization.
- Data collection and reporting: Establishing effective systems for collecting and reporting sustainability data can be complex, particularly when data sources are dispersed across different functions.
Complementary NAM Climate Journey Map: Stage Two →
Watch: What Are Science-based Targets

Watch: the Benefits of Science-based Targets
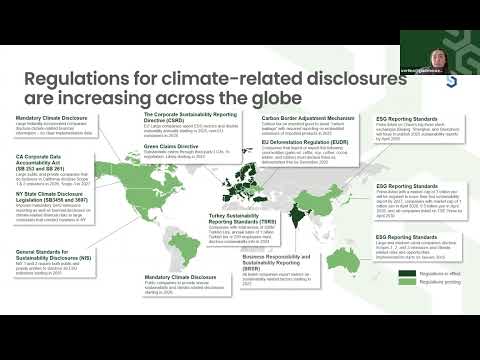
Science-based targets are the focus of this course!
Read: Science-based Target Overview
Science-based Target
Let climate science define how much and how fast to reduce emissions in line with the goals of the Paris Agreement.
Climate Neutrality Target
Commit to achieving a state where you compensate emissions from all your activities with high-quality carbon credits by a certain year.
Read: Emission-Reduction Target Setting Options
Target Setting Options
There are other kinds of emissions reduction targets that are not science-based. Click through the list below to learn more about different kinds of target options.
Extrapolation Target Based on Past and Expected Future Performance
Set a goal based on your historical emission trend and planned abatement measures.
Peer Alignment Target
Assess your peers' emission reduction targets and choose how to position yourself within the industry.
Climate Neutrality Target
Commit to achieving a state where you compensate emissions from all your activities with high-quality carbon credits by a certain year.
Science-Based Target
Let climate science define how much and how fast to reduce emissions in line with the goals of the Paris Agreement. Science-based targets are the focus of this course!
A science-based target is a GHG emissions reduction target in line with what the latest climate science says is necessary to meet the Paris Agreement goals. Science-based targets can be validated by the Science-based Targets Initiative (SBTi), a corporate climate action organization that develops standards, tools, and guidance to allow companies to set GHG emissions reduction targets.
Setting a science-based target ensures that your business is aligned with the Paris Agreement in the near-term (5–10 years) and long-term (20–30 years) to reach Net-Zero by 2050.
Read: Net-Zero
What Is Net-Zero?
A phrase brought up frequently with science-based targets is "Net-Zero." Formally speaking, net-zero means anthropogenic emissions of greenhouse gases released to the atmosphere are balanced by anthropogenic removals over a given time period. In the context of target setting, a net-zero target is a type of science-based target covering the long-term, up to 2050. It focuses on rapid, deep emission cuts as much as possible, balanced by removing an equivalent amount of emissions from the atmosphere.
Companies often choose to set a Net-Zero target, in addition to their near-term science-based targets, to ensure business alignment with the Paris Agreement in the long term.
Rating Your Science-Based Target Setting Confidence
On a scale of 1–5, how are you feeling about helping your company set science-based targets?
Select one answer.
Activity: Example Science-Based Targets
Explore real science-based targets from peer companies by clicking on the links below.
An important note is that it is more important for companies to set a time-bound emissions target aligned to climate science than to set a target validated by the Science-based Targets Initiative (SBTi), the highest standard for validating science-based targets. Vertex and AstraZeneca both have legitimate science-based targets, but only AstraZeneca's target has been validated by SBTi.
Activity: Identifying Peer Targets
When determining what kind of target your company should set, it can be helpful to identify what kind of targets your peers have set. You may also look at your peer companies' websites, annual reports, or CDP responses to see what type of targets they have.
| Company | Scope 1 & 2 | Scope 3 | Comments |
|---|---|---|---|
| Peer Company A | Absolute reduction of 90% by 2030 from a 2019 base year | Absolute reduction of 28% by 2030 from a 2019 base year for purchased goods & services, upstream T&D, business travel, and use of sold products | Committed to Net-Zero across all scopes by 2050 |
| Peer Company B | Absolute reduction of 50% by 2030 from a 2019 base year | 75% of its suppliers by spend (covering purchased goods and services and upstream transportation and distribution) will have science-based targets by fiscal year 2028 | N/A |
| Peer Company C | 50% reduction by 2030 from 2020 baseline | Engaging suppliers to reduce emissions | Science-based targets approved |
| Peer Company D | 25% reduction by 2030 from 2020 baseline | Developing supplier engagement programs | Focus on energy efficiency and renewable sourcing |
Read: Information to Help Decide What Target to Set
Target Setting Is a Repeated Process
Setting a science-based target involves setting a series of short- and medium-term targets (5 to 10 years out), eventually leading to zero emissions in the long term (e.g., by 2050).
Three Key Steps to Determine What Kind of Target to Set
To help you define the targets you would like to set, you will need to gather some information. This data can help you get a better picture of how your emissions have previously, and will continue to, evolve.
Understand Your Past Emissions
- Gather your Scope 1, 2, and 3 GHG footprint and familiarize yourself with it
- Identify the emissions hotspots for your company to date — what are your biggest sources of emissions?
- This is typically owned by your sustainability team or a climate committee
Example: After reviewing their GHG footprint, Formula Pharma's sustainability team determined its emissions totals and hotspots.
Assess Current Initiatives
- Gather data on any current or past projects that have reduced energy or emissions (e.g., energy efficiency)
- Understand what your company can reasonably achieve in terms of emissions reductions and what the costs are
- This information will help define how you can progress against your targets with planned projects
- Common departments with this information: facility management, environment, health and safety (EHS), procurement, and supply chain
Example: Formula Pharma currently undertakes: renewable electricity procurement, supplier climate education/training, supply chain clean financing for renewable energy adoption, and packaging reduction and eco-materials.
Future Organic Business Growth
- Gather projections on future organic growth rate in the next 5–10 years — only a single high-level estimate is needed
- Choose a growth metric that is most representative of Scope 1 & 2 and 3 emissions (common examples: Scope 1 & 2 — facility square footage, employee headcount; Scope 3 — % gross profit change, forecasted procurement spend, production growth)
- Departments that might have this information: finance, strategy, or operations
Example: Formula Pharma's sustainability team determines that their organic growth rate is 7% compounded per year, based on projections from finance. Because Formula Pharma's Scope 3 emissions utilize mostly spend-based methodology, financial growth projections align with emissions growth.
Checking In: Data Gathering Confidence
On a scale of 1–5, how confident do you feel about gathering data to help set a target?
Select one answer.
Read: The Four Principles for Setting a Science-Based Target
The Four Target Setting Principles
There are four key principles for setting a science-based target: boundary, timeframe, level of ambition, and what is included. These topics cover four key questions:
- Boundary: How much of your company's Scope 1, 2, and 3 emissions will you cover in your target?
- Timeframe: How many years into the future do you plan to achieve your target?
- Ambition: What percent of emissions are you going to target to reduce each year?
- What's included: Can offsets and avoided emissions be part of my science-based target?
Boundary
When setting a science-based target, you need to think about what portion of your emissions you'll include in the target. The purpose of setting a boundary is that you can exclude certain things that are smaller in impact and difficult to quantify or control.
- Scope 1 & 2 targets have a minimum boundary requirement of 95%
- If your Scope 3 emissions are at least 40% of your total emissions, you must set a Scope 3 target
- Scope 3 targets must cover at least 2/3 (66.67%) of a company's Scope 3 emissions
Timeframe
Setting a timeframe for your science-based target means determining when you plan to achieve your target, and what year you'll be comparing your progress against.
- A near-term target ends 5 to 10 years from the date the target is set
- A long-term target is longer than 10 years from the date the target is set
- To set a target, you must include a base year and most recent year of GHG data. It is typically recommended for companies to have the most recent year be their base year
Ambition
There are two levels of ambition for science-based targets, aligning with two different global warming scenarios: 1.5°C or a well-below 2°C emission reduction pathway.
- All companies are required to set Scope 1 and 2 targets at a rate to keep global warming to no more than a 1.5°C increase — a minimum 4.2% reduction per year on average
- For Scope 3 targets, the minimum ambition is well below 2°C — a minimum 2.5% reduction per year on average
What's Included
Currently, offsets and avoided emissions are not considered a part of near-term science-based targets.
- Offsets: Company pays for an entity outside Scope 3 value chain to reduce their emissions. Example: Company pays someone else to plant trees outside the company's land.
- Avoided emissions: Reductions occur outside a product's lifecycle or value chain but result from the product's use. Example: Emissions from driving to work are "avoided" when you use video conferencing software, allowing you to work from home.
Wrap up: Lesson 4.1
Lesson recap
Overview of Science-based Targets
Limiting warming to 1.5˚C is imperative, or we will experience severe, pervasive, and irreversible impacts for people and ecosystems. Global companies across the healthcare industry have made climate commitments to decarbonize and contribute to the health of the planet and people. You can help meet Paris Agreement goals. A science-based target is a GHG emissions reduction target in line with what the latest climate science says is necessary to meet the Paris Agreement goals.
Value of Science-based Targets
SBTs meet growing stakeholder needs. Regulations for climate-related disclosures are increasing across the globe. Brand reputation may be boosted. SBTs drive innovation and help a company gain a competitive advantage.
Target Setting Process
Identified what information is needed to help you decide what target to set. Introduced the concepts of boundary, timeframe, ambition, and what’s included.
Want to Learn More?
Click the resources below to explore further!
- The 1.5°C Business Playbook — Exponential Roadmap Initiative
- Accelerating Health Equity and Business Resilience through Decarbonization — BDHEA
- Accelerating the Delivery of Net Zero Health Systems — SMI HSTF Executive Summary
- Manufacturing 2030: Activate Program — Secaro
- Best Practices from Top Reprocessing Hospitals — AMDR
- CDP: Turning Transparency to Action
- Decarbonising Healthcare Supply Chains — SMI HSTF Whitepaper
- Disaster Available Supplies in Hospitals (DASH) Tool — ASPR TRACIE
- EcoVadis — Supply Chain Sustainability Intelligence
- FAQs on Target Setting — Science Based Targets Initiative (SBTi)
- GHG Protocol
- GHG Protocol Online Training — E-Learning Opportunities
- Global Reporting Initiative (GRI)
- The Green Print: Advancement of Environmental Sustainability in Healthcare — ScienceDirect
- Moving Forward Guide — Climate for Health
- Overview Report: Embedding Environmental Sustainability into Pharma’s DNA — Deloitte UK
- Renewable Thermal Collaborative
- Sustainability Accounting Standards Board (SASB) — Standards Navigator
- SASB Materiality Finder
- Sustainability Roadmap for Health Care — American Hospital Association
- Sustainable Procurement — Guidance $ — ISO 20400:2017
- Task Force on Climate-related Financial Disclosures (TCFD)
- TCFD Knowledge Hub
$ Indicates resource may require payment or be behind a paywall.
Evaluating Potential Targets

What you will learn
- Understand key methodologies for Scope 1, 2, and 3 emissions
- Identify when each methodology may be appropriate based on sector and emissions profile
- Distinguish between net-zero and carbon-neutral goals
Watch: Decision Making Criteria
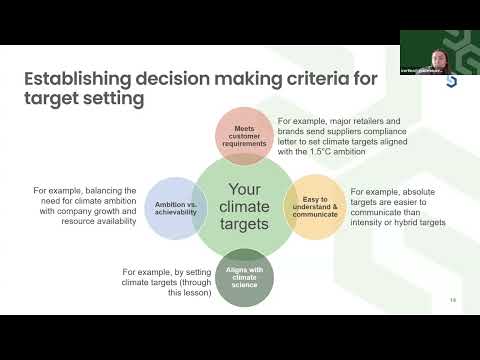
Reference: Questions Covered by the Four Principles
Previously, we explored the four key principles for setting a science-based target: boundary, timeframe, level of ambition, and inclusions. This page offers guiding questions to help you reflect and orient yourself as you begin setting your own science-based target.
Boundary
How much of your company's Scope 1, 2, and 3 emissions will you cover in your target?
Timeframe
How many years into the future do you plan to achieve your target?
Ambition
What percent of emissions are you going to target to reduce each year?
Offsets
Can offsets and avoided emissions be part of your science-based target?
Peer Benchmarking
Peer benchmarking is a tool that can help you decide your target setting criteria based on your peers and customers. To compare your own peer companies, review the targets your peers have set — you can find these on their company websites, annual reports, or CDP responses.
Read: Setting Boundaries for Science-Based Target Setting
Let's Review How to Set Boundaries Using Our Illustrative Companies
As a reminder, minimum boundary requirements apply to Scope 1 and Scope 2 emissions combined, as well as to Scope 3 emissions independently. The purpose of establishing a boundary for a science-based target is to allow for the exclusion of elements that are relatively minor in impact and challenging to quantify or control.
Apex Medical Example
Apex Medical Supply & Device Co. only has accurate data and the ability to influence and engage with categories 1 and 2 suppliers. They also only want to set a near-term target. Therefore, they are only including emissions from categories 1 & 2 in their target, covering 75% of total Scope 3 emissions.
Formula Pharma Example
Formula Pharma determined that they have relatively good quality data and can reasonably influence suppliers and customers across multiple categories. They also want to set a long-term target, in addition to the near-term target. Therefore, they are including emissions from almost all Scope 3 categories in their target, covering 90% of total Scope 3 emissions.
Read: Net-Zero Target vs. SBT
Science-Based Targets Lead to Net-Zero Targets in the Long Term
Net-zero targets have different criteria than a science-based target even though the overall goal of a science-based target is to become net-zero. Click through the principles below to see the differences.
Boundary
SBT Criteria: Scope 1 & 2 >95% coverage | Scope 3 >67% coverage
Net Zero Criteria: Scope 1 & 2 >95% coverage | Scope 3 >90% coverage
Timeframe
SBT Criteria: 5–10 years from when target is set
Net Zero Criteria: Achieve targets not later than 2050 for most sectors
Ambition
SBT Criteria: Scope 1 & 2: 1.5°C | Scope 3: Well-below 2°C
Net Zero Criteria: Reduce Scope 1, 2 & 3 absolute gross emissions in line with 1.5°C pathway and at least 90% by the target year, balance residual emissions with carbon removals
Offsets
SBT Criteria: Offsets are not allowed
Net Zero Criteria: Offsets are allowed for remaining 10%
Long-Term Ambition: Setting a Net-Zero Target
The first step for you will be to set a near-term target. However, the long-term goal will be to set a net-zero target. LOCT for Healthcare recommends setting a net-zero target, but it is not required for the course.
Key differences between near-term and long-term net-zero targets:
- For Scope 3, net zero boundary requirements expand significantly from 67% to 90%
- Net-zero target years can be any time up to 2050
- Net zero ambition levels require 90% absolute reduction; the remaining 10% can be met with carbon removals
Science-Based Targets Initiative Net-Zero Standard →
Net-Zero vs. Carbon-Neutral
When discussing climate-related goals, it's important to understand the distinction between net-zero and carbon-neutral approaches. Net-zero prioritizes the use of reductions over removals. Carbon-neutral goals usually mean purchasing credits and offsets. Net-zero goals are meant to ensure companies are aligned with the Paris Agreement not only in the short term, but also in the long term.
Read: Target Setting Methodology Options
When to Use Each Methodology
- Absolute Contraction: You can potentially use this method if you’re looking for a straightforward approach that applies a fixed emissions reduction across your operations, regardless of growth
- Sectoral Decarbonization Approach (SDA): You might consider this if your company operates in a sector with defined decarbonization pathways and you want to align with industry-specific benchmarks
- Economic Intensity: This could be a good fit if your emissions are closely tied to financial performance and you prefer targets that scale with revenue or economic output
- Physical Intensity: You may want to use this if your emissions are linked to physical production and you need a metric that reflects operational efficiency
- Supplier/Customer Engagement: This is worth considering if a significant portion of your emissions falls under Scope 3 and you aim to drive reductions through your value chain
Read: Overview — Scope 1–3 Target Setting Methodologies
In order to set science-based targets, the SBTi has developed specific methodologies. Depending on the scopes covered, your sector, and any existing goals, only certain methodologies may apply to your organization. Companies have more options when setting Scope 3 targets since emissions are indirect and more difficult to collect and influence.
| Target Setting Methodology | Scope 1 & 2 | Scope 3 |
|---|---|---|
| Absolute Contraction | ✓ | ✓ |
| Sectoral Decarbonization Approach (Physical Intensity) | ✓ | ✓ |
| Economic Intensity and Physical Intensity | — | ✓ |
| Supplier/Customer Engagement | — | ✓ |
Let's look at each of these methodologies in more detail now…
Read: Absolute Contraction — Company Examples
The absolute contraction methodology says all companies have to reduce emissions by the same absolute percentage. It is the simplest approach and doesn't consider company-specific attributes such as growth or sector.
- Consilient Health commits to reduce absolute Scope 1 and 2 GHG emissions 42% by 2030 from a 2021 base year.
- Merck & Co. commits to reduce absolute Scope 1 and 2 GHG emissions 46% by 2030 from a 2019 base year.
Note: Companies in the examples may not have necessarily set their targets using the methodology described. These examples are illustrative.
Read: Sectoral Decarbonization Approach (SDA)
Sectoral Decarbonization Approach (SDA)
Target depends on the company's sector, base year emissions, and growth. Only certain sectors can use this approach. Targets are communicated on an absolute or physical intensity basis.
SDA Sectors
Each sector has a different pathway and emissions budget as determined by climate science. Companies in the power sector, maritime transport, and FLAG companies are required to follow SDA.
Sectors: Air transport, Iron and steel, Maritime transport, Buildings, Cement, Chemicals (tentatively), Financial institutions, Electric utilities and power generation.
Example
- Glenmark commits to reduce GHG emissions from purchased goods and services, fuel and energy-related activities, downstream transportation and distribution, and investments 28% per ton of pharmaceutical products by FY2035 from FY2021.
Note: Companies in the examples may not have necessarily set their targets using the methodology described. These examples are illustrative.
Read: Economic and Physical Intensity
Economic Intensity Targets
Reduce emissions at least 7% year-on-year (compounded) per unit value added for all companies regardless of sector. Value added is defined as: sales revenue minus cost of goods and services purchased from external suppliers, or gross profit, or operating profit (earnings before interest and depreciation + all personnel costs).
- Economic intensity only applies to Scope 3 since economic indicators are considered less accurate indicators of emissions than activity indicators
- Not recommended for sectors with volatile pricing (e.g., pharmaceuticals, luxury brands, commodity traders)
Physical Intensity Approaches
If setting a physical intensity target that is not the SDA, a company target must: not result in an increase in absolute emissions, and achieve a physical intensity reduction at a minimum rate of 7% year-on-year over the target timeframe.
Physical intensity metrics are best suited for use within sectors that create a homogenous product (e.g., bulk chemicals) and may be less suitable for companies with a diverse product mix.
- Merck KGaA commits to reduce Scope 3 GHG emissions 52% per euro value added by 2030 from a 2020 base year. (Economic Intensity Target)
- Chiesi commits to reduce Scope 3 GHG emissions from use of sold products 22% per unit of respiratory product sold by 2030 from a 2019 base year. (Physical Intensity Approach)
Read: Supplier or Customer Engagement
Supplier or customer engagement targets specify a portion of suppliers/customers that shall have science-based targets. Targets must cover at least 2/3 of supplier or customer emissions or spend. The suppliers or customers must set SBTs within five years from the year the target is set.
- AstraZeneca commits that 95% of its suppliers by spend covering purchased goods and services and capital goods, and 50% of its suppliers by spend covering upstream transportation and distribution and business travel, will have science-based targets by 2025.
- Pfizer Inc. commits to reduce absolute Scope 3 emissions 25% from business travel by 2025, 10% from upstream transportation and distribution by 2025, and that 64% of its suppliers by spend covering purchased goods & services will have science-based targets by 2025.
Read: Renewable Electricity Target (Optional)
Committing to Sourcing Renewable Electricity up to 100% by 2030
You may consider setting a RE target in addition to setting a Scope 1 & 2 reduction target. Using this method, companies set targets to actively procure at least 80% renewable electricity by 2025 and 100% renewable electricity by 2030 using renewable energy certificates (RECs) or virtual power purchase agreements (VPPAs).
- Can align with your existing energy procurement strategy
- For renewable electricity procurement best practices, refer to the RE100 framework
Example
- Molnlycke reached 100% renewable electricity for all its established and new manufacturing sites and its headquarters in 2025, helping them reach their goal of halving Scope 1 and 2 GHG emissions by 2030.
Note: Companies in the examples may not have necessarily set their targets using the methodology described. These examples are illustrative.
Activity: Scope 1–3 Methodologies
Matching Target Setting Methodologies with Their Definitions
Match each target setting methodology with its correct definition.
Review each description, then click Reveal Answer to see the full definitions.
All definitions above are correct — this is a review activity to reinforce the six target-setting methodologies.
Wrap up: Lesson 4.2
Lesson recap
Target Setting Principles Review
- Boundary: How much of your company’s scope 1, 2, and 3 emissions will you cover in your target?
- Timeframe: How many years into the future do you plan to achieve your target?
- Ambition: What percent of emissions are you going to target to reduce each year?
- What’s included: Can offsets and avoided emissions be part of my science-based target?
Scope 3 Target Setting Methodologies
- Absolute Contraction: Requires a fixed percentage reduction in absolute emissions over time, regardless of company growth
- Sectoral Decarbonization Approach (SDA): Aligns emissions reduction targets with sector-specific decarbonization pathways based on physical intensity
- Economic Intensity: Sets targets relative to economic output, such as emissions per unit of revenue
- Physical Intensity: Bases targets on emissions per unit of physical output, like products manufactured or sold
- Supplier/Customer Engagement: Focuses on influencing value chain emissions by encouraging suppliers or customers to set science-based targets
Comparing & Determining Which Target Setting Option to Use
- Identify which target setting methodologies may be appropriate for your company
- Calculate potential target options using each methodology that you are considering
- Compare methodology options by evaluating the total amount of carbon reduction needed to meet targets, as well as additional considerations
Scope 3 Target Setting
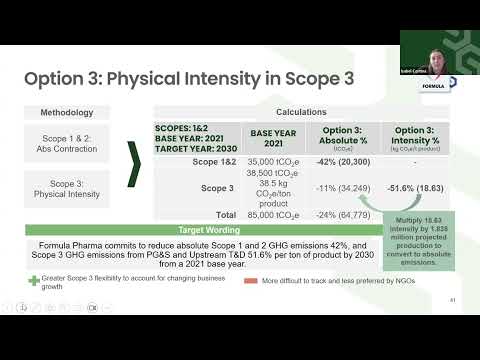
Watch: Learn How to Calculate a Physical Intensity Target Across Scope 3
Formula Pharma wants to explore if a physical intensity target might be a better option than absolute contraction for Scope 3. Watch the video to learn how Formula Pharma can set a physical intensity target!
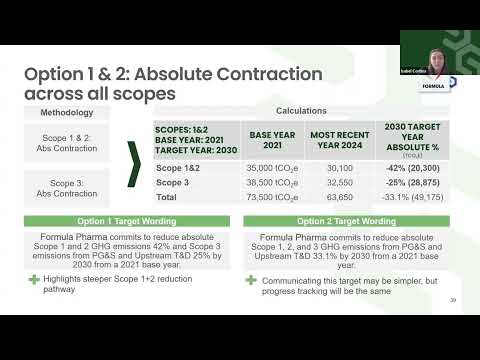
What You Will Learn
What you will learn
- Review target setting principles
- Learn about Scope 3 methodologies
- Walk through a target development case study
Reminder: SBTi Near-Term and Long-Term Criteria
Near- and Long-Term Target Setting Criteria Involve Four Key Principles
As discussed in lesson 4.1, there are four key principles for setting a science-based target: boundary, timeframe, level of ambition, and what is included.
Boundary
SBT Criteria: Scope 1 & 2 >95% coverage | Scope 3 >67% coverage
Net Zero Criteria: Scope 1 & 2 >95% coverage | Scope 3 >90% coverage
Timeframe
SBT Criteria: 5–10 years from when target is set
Net Zero Criteria: Achieve targets not later than 2050 for most sectors
Ambition
SBT Criteria: Scope 1 & 2: 1.5°C | Scope 3: Well-below 2°C
Net Zero Criteria: Reduce Scope 1, 2 & 3 absolute gross emissions in line with 1.5°C pathway and at least 90% by the target year, balance residual emissions with carbon removals
What's Included
SBT Criteria: Offsets are not allowed
Net Zero Criteria: Offsets are allowed for remaining 10%
Help Formula Pharma Understand the Timeframe & Ambition for Their Science-Based Target
Match the principle with the activity that is best practice for that category to help Formula Pharma set their science-based targets.
Review the definitions, then click Reveal Answer.
Activity: Small and Medium Enterprises
Small and Medium Enterprises
Before we dive into this lesson, it is important to identify if your company is a small and medium enterprise (SME). If your company is an SME, you may have less complex target-setting requirements, including no need to set a Scope 3 target, but still the option to. Reference the flow chart below to determine if your company qualifies as an SME.
Determining SME Status
Does your company qualify as an SME (Small and Medium Enterprise)?
Select one answer.
Read: Scope 3 Target Setting Methodologies
SBTi Requires Companies to Use Specific Methodologies
Companies may use any of these options when setting Scope 3 targets since emissions are indirect and more difficult to collect and influence.
Absolute Contraction
Each company reduces its absolute emissions with the same percentage aligned with global, 2°C, well-below 2°C or 1.5°C pathway. For Scope 1&2 only the more ambitious well below 2°C and 1.5°C are accepted by the SBTi.
Can be used for Scope 1, 2, and 3 targets.
SDA or Physical Intensity
SDA: Each company in a specific sector converges its emissions intensity (e.g., tonne CO2e/GWh) towards the specific sector pathway by 2050. Can be used for Scope 1, 2, and 3 targets.
Physical intensity: Each company reduces its emission intensity based on a customized metric (e.g., per unit of product sold). Can be used for Scope 1, 2, and 3 targets.
Supplier Engagement
Company targets that drive the adoption of science-based emission reduction targets by their suppliers (number of suppliers that set SBTs). Can be used for Scope 3 targets.
Economic Intensity
A carbon budget is equated to global GDP, and a company's share of emissions is determined by its gross profit. Economic intensity targets that result in at least 7% year-on-year reduction of emissions per unit value added (tonne CO2e/added value).
Can be used for Scope 3 targets.
Read: Example Scope 3 Targets for Formula Pharma
Let's Take a Look at What a Target Would Look Like for Formula Pharma Using Each of These Approaches
Reminder: Formula Pharma's Scope 3 boundary includes PG&S and upstream T&D making up 77% of total Scope 3 emissions.
Absolute Contraction
Formula Pharma commits to reduce absolute Scope 3 GHG emissions from PG&S and Upstream T&D 25% by 2030 from a 2021 base year.
SDA or Physical Intensity
SDA: Not viable for Formula Pharma because pharmaceuticals is not one of the sectors with an approved SDA pathway.
Physical intensity: Formula Pharma commits to reduce Scope 3 GHG emissions from PG&S and Upstream T&D 51.6% per ton of product produced by 2030 from a 2021 base year.
Supplier Engagement
Formula Pharma commits that 70% of its suppliers by emissions covering PG&S and Upstream T&D will have SBTs by 2026.
Economic Intensity
Formula Pharma commits to reduce Scope 3 GHG emissions from PG&S and Upstream T&D 51.6% per USD of gross profit by 2030 from a 2021 base year.
Watch: Learn How to Calculate a Physical Intensity Target Across Scope 3
Formula Pharma wants to explore if a physical intensity target might be a better option than absolute contraction for Scope 3. To make this comparison, Formula Pharma needs to calculate its physical intensity and create a target based on these calculations. Learn how Formula Pharma can set a physical intensity target below!
Read: Comparing and Determining Target Options
Comparing target options for Formula Pharma?
Now that we've calculated target options for Formula Pharma using the absolute contraction and physical intensity approach, let's compare these options to determine which one Formula Pharma should use to set their target.
SDA Convergence Pathway

| Option 1: Reduce Scope 1&2 42%, Reduce Scope 3 25% | Option 2: Reduce Scope 1, 2, and 3 by 33.5% | Option 3: Reduce Scope 1&2 42%, Reduce Scope 3 intensity by 51.6% | |
|---|---|---|---|
| Scope 1&2 Reductions | 35,000 – 20,300 = 14,700 tCO₂e | 73,500 – 49,175 = 24,325 tCO₂e | 35,000 – 20,300 = 14,700 tCO₂e |
| Scope 3 Reductions | 38,500 – 28,875 = 9,625 tCO₂e | See Scope 1&2 reductions | 28,500 - 34,429 = 4,071 tCO2e |
| Additional Considerations | Highlights Scope 1 & 2 ambition | Simplest to communicate | Least scope 3 reductions |
Guide to Determine Methodology for Scope 3 Targets
Not sure what approach is best for your company? We’ve laid out a brief flowchart that highlights most of the considerations you may want to take into account when choosing a target setting approach. This is included as a reference so that as you go through the complex decision-making process in Scope 3, you can choose the approach that makes the most sense for your organization.
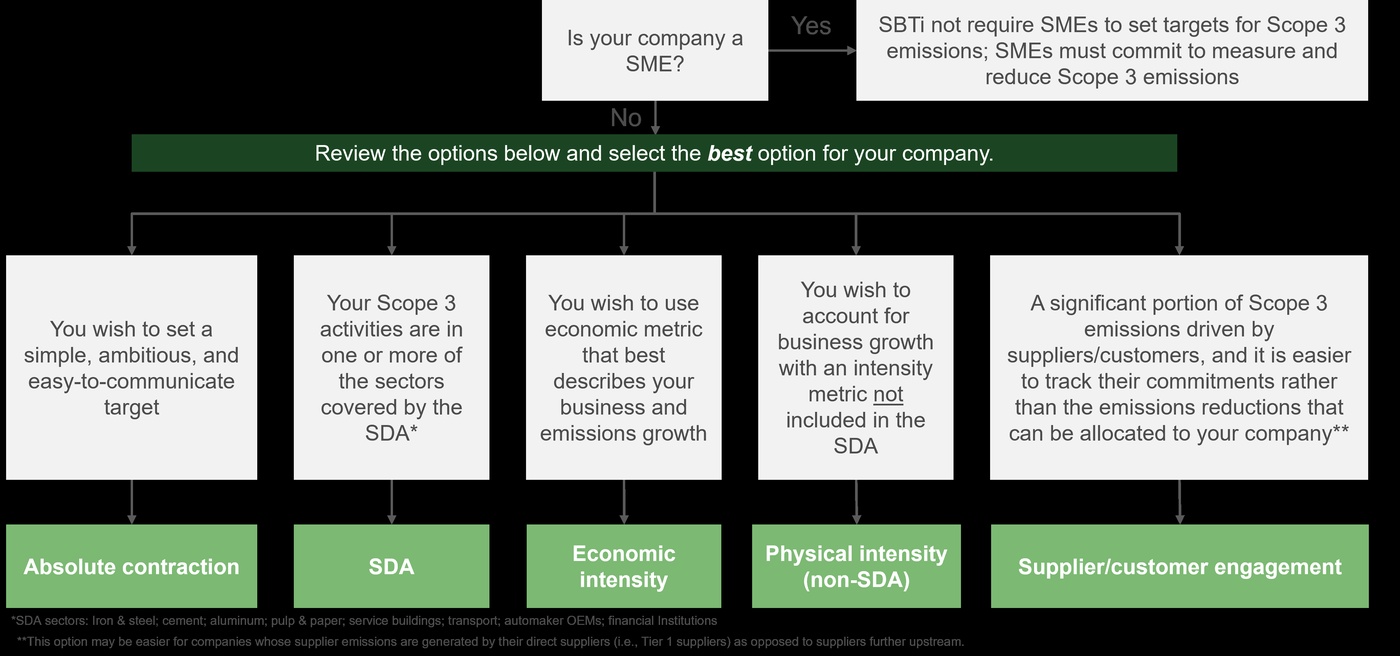
What should Formula Pharma do?
Formula Pharma target setting
If you were Formula Pharma and want to set an easily communicated target, which target option would you choose?
Select one answer.
Wrap up: Lesson 4.3
Lesson recap
Target Setting Principles Review
- Boundary: How much of your company's scope 1, 2, and 3 emissions will you cover in your target?
- Timeframe: How many years into the future do you plan to achieve your target?
- Ambition: What percent of emissions are you going to target to reduce each year?
- What's included: Can offsets and avoided emissions be part of my science-based target?
Scope 3 Target Setting Methodologies
- Absolute Contraction: Requires a fixed percentage reduction in absolute emissions over time, regardless of company growth
- Sectoral Decarbonization Approach (SDA): Aligns emissions reduction targets with sector-specific decarbonization pathways based on physical intensity
- Economic Intensity: Sets targets relative to economic output, such as emissions per unit of revenue
- Physical Intensity: Bases targets on emissions per unit of physical output, like products manufactured or sold
- Supplier/Customer Engagement: Focuses on influencing value chain emissions by encouraging suppliers or customers to set science-based targets
Comparing & Determining Which Target Setting Option to Use
- Identify which target setting methodologies may be appropriate for your company
- Calculate potential target options using each methodology that you are considering
- Compare methodology options by evaluating the total amount of carbon reduction needed to meet targets, as well as additional considerations
Internal Buy-in and External Recognition
This lesson focuses on what to do once you have set a science-based target. The next steps we will talk about are receiving internal buy-in from your company and gaining external recognition.

What you will learn
- Effectively engage with internal stakeholders by assessing abatement potential, communicating your climate targets, and building a compelling business case
- Understand how to gain leadership buy-in for your initiatives
- Identify next steps and explore ways to continuously improve your climate journey
This figure shows the Chapter 4 Overview. Lesson 4.4 focuses on gaining internal buy-in and receiving external recognition.
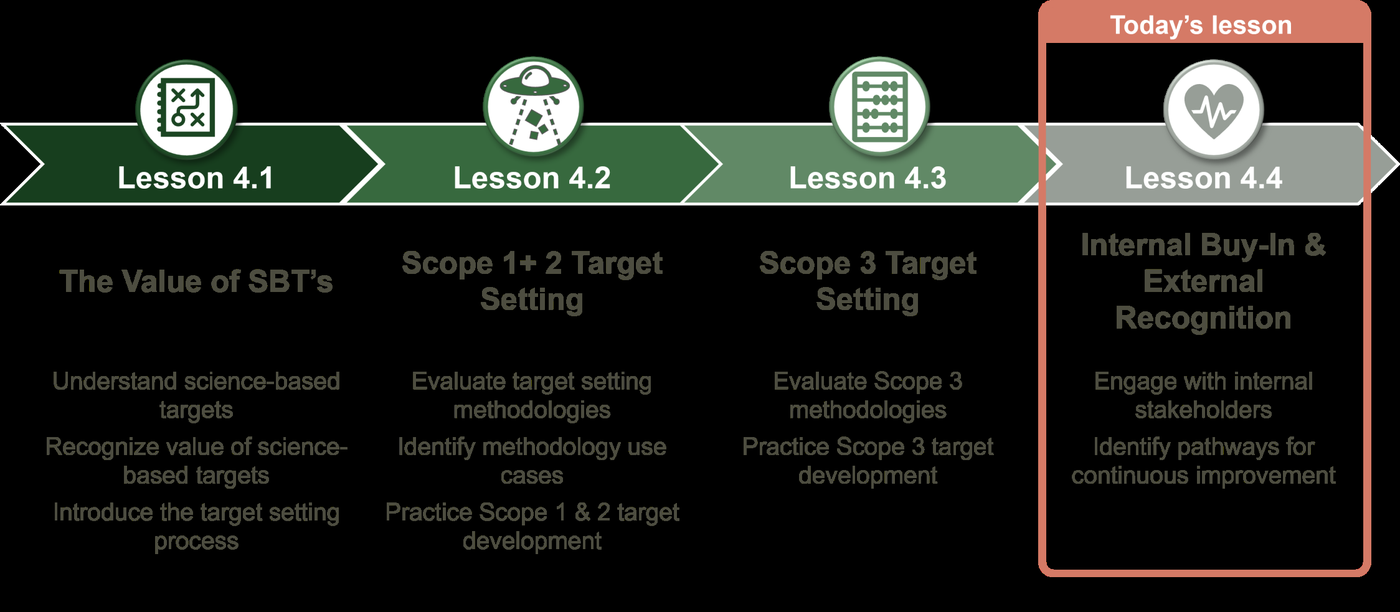
Read: Identifying Internal Stakeholders
Identifying Internal Stakeholders Will Help Socialize and Generate Buy-in for Your Proposed Target
Internal stakeholders exist at different functions and levels within a company and all play a role in operationalizing and making progress toward your target. The photo below shows an example structure. However, it might look different for your organization.
Example Stakeholder Map and Target-related Responsibilities
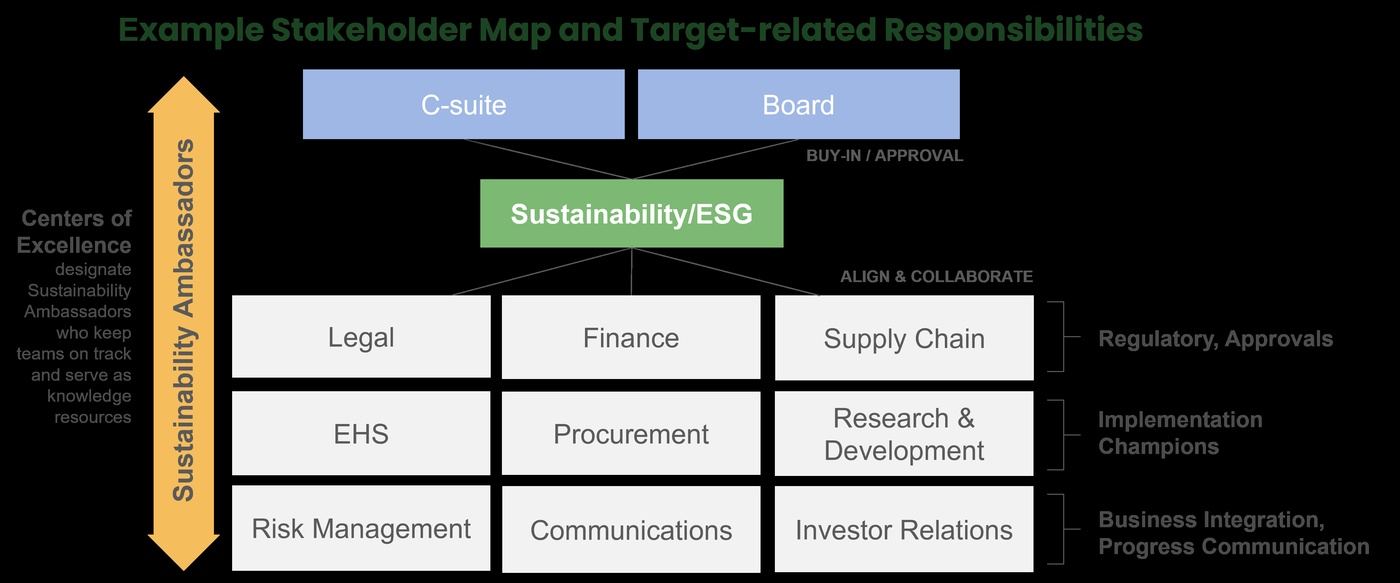
Read: Engage with Stakeholders on Targets
Stakeholders Are Critical to Engage to Advance on Your Climate Journey
The stakeholders we suggest you engage with are the ones you drew on your stakeholder map. Follow the steps below to begin engaging with stakeholders:
- Identify who: Address colleagues who are responsible for activities in line with the identified GHG reducing priorities (e.g., energy efficiency, renewable energy, procurement, transportation).
- Gain buy-in: Emphasize how your work is helping the company to achieve an important target to reduce GHGs and business objectives. One example is that customers, leadership, and investors might be asking for your targets!
- Gather budget needs: Do your stakeholders have an annual budget and payback requirements that these investments or purchases need to achieve?
- Ideate & plan: You should now have the money and a list of abatement ideas. Now you need to plan for how the various measures can be implemented. Some questions you might need to ask: Do we need to shut down equipment or the plant for installation? Do we need to bring in more people?
Scope 3 emissions can be more difficult to abate. Ensuring you are contacting the right internal teams and asking the correct questions is a critical first step to reducing Scope 3 emissions.
Watch: Process for Executive Approval
Stakeholder Engagement and Alignment and Leadership Buy-in
Stakeholders are involved at different stages of the executive approval process. Watch the video to learn who to engage at each step.
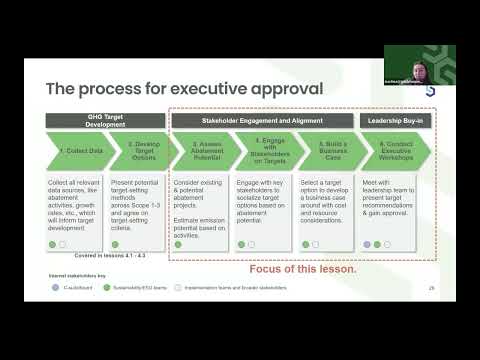
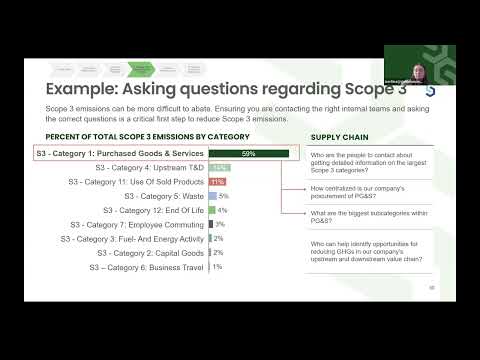
Read: Assess Abatement Potential
Abatement Planning Can Help Get Internal Buy-in on Targets
When seeking internal or executive approval for setting science-based targets, developing an abatement plan can be a powerful tool. It helps outline how your organization plans to meet its targets and provides a clear starting point for action.
For sustainability professionals, the technical details behind these targets are often second nature. However, key stakeholders may not share that same background. An abatement plan helps bridge this gap — making your strategy more accessible and actionable for decision-makers.
- Abating (i.e., reducing) GHG emissions is the next step in your climate action journey after setting an SBT
- Creating an abatement roadmap to achieve targets can build executive buy-in to approve the target
- Calculating specific GHG reduction measures relevant to your company and associated costs will require company-specific information
Watch: Assessing Abatement Potential
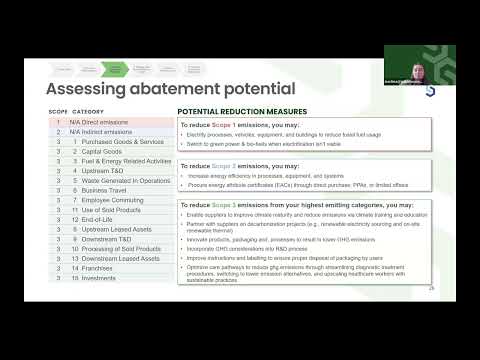
Potential Reduction Measures
- To reduce Scope 1 emissions, you may:
- Electrify processes, vehicles, equipment, and buildings to reduce fossil fuel usage
- Switch to green power & bio-fuels when electrification isn't viable
- To reduce Scope 2 emissions, you may:
- Increase energy efficiency in processes, equipment, and systems
- Procure energy attribute certificates (EACs) through direct purchase, PPAs, or limited offsets
- To reduce Scope 3 emissions from your highest emitting categories, you may:
- Enable suppliers to improve climate maturity and reduce emissions via climate training and education
- Partner with suppliers on decarbonization projects (e.g., renewable electricity sourcing and on-site renewable thermal)
- Innovate products, packaging, and processes to result in lower GHG emissions
- Incorporate GHG considerations into R&D process
- Improve instructions and labelling to ensure proper disposal of packaging by users
- Optimize care pathways to reduce GHG emissions through streamlining diagnostic treatment procedures, switching to lower emission alternatives, and upscaling healthcare workers with sustainable practices
Read: Build a Business Case
Core Components of a Business Case
There are four main components of a business case. The overall goals of building a business case for abatement projects are to clarify the value, build credibility, bridge knowledge gaps, and support overall decision making.
-
The “Why”
Why are you setting a science-based target?
Climate leadership, Customer request, Regulations and compliance, Investors and stakeholders -
The “What”
What target are you setting?
1.5 or 2 degrees Celsius aligned targets; Absolute, intensity, or another methodology of setting a target -
The “How” and “How Much”
How are you going to achieve it and how much will it cost? -
The “Who”
Who will be in charge of implementing the abatement project?
Watch: Quantifying Abatement Measures
Quantifying Abatement Measures
To help create a business case, you will need to understand how to quantify abatement measures. Watch the video to learn about this process.
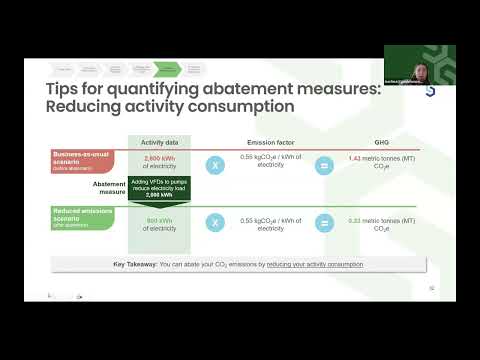
Practicing abatement calculations
You reduced your activity consumption from 3,000 kWh to 1,000 kWh of electricity. The emission factor in your region is 0.55 kgCO2e/kWh of electricity. What was the total reduction of emissions?
Select one answer.
Your facility used a total of 3,000 MMBtu of energy for operations. Originally, 100% of this energy came from coal. You’ve now replaced 50% of that energy use with natural gas. Use the following emissions factors to quantify the abatement measure: Coal (bituminous): 93.28 kg CO₂ per MMBtu — Natural Gas: 53.06 kg CO₂ per MMBtu. What is the total CO₂ emissions reduction (in metric tons) from switching 50% of your energy use from coal to natural gas?
Select one answer.
Read: Conduct Executive Workshops
Management May Be Interested in Different Topics to Help Choose a Target
Depending on your company’s culture, the leadership team may be interested in looking at different aspects that will inform the target setting decision. For example, they may be interested in seeing a target trajectory over the target timeframe comparing to the business-as-usual trajectory. This will allow leadership to see how the targeted emission reduction pathway tracks against the BAU scenario if no action is taken.
An executive workshop can help you talk through these topics. Use the table below to help steer your conversation.
| Information to Present | Examples |
|---|---|
| The GHG target compared to current emissions pathways | See homework example from previous lessons |
| Potential reduction levers, their emissions impacts, and costs | e.g., upgrading HVAC systems in company’s top 5 factories will reduce emissions 1% per year and cost $1M |
| Regulatory requirements | Are there any climate regulations that you need to be aware of related to target setting (explicitly or indirectly)? |
| Risks | Regulatory risks and reputational risk for not meeting the public target |
| Benefits | Responding to stakeholder pressure, such as investor shareholder resolutions, reduced transition risks |
| Commitment from relevant departments | Procurement, finance, sales, sustainability, facility managers |
| Performance compared to peers | Whether peers are demonstrating higher climate performance |
| Alignment with business goals | Does the company strategy need to be adapted? |
Watch: Formula Pharma Gaining Internal Buy in and External Recognition
Walk Through How Formula Pharma Communicates Its Target Internally
Formula Pharma is now at the phase where they are seeking internal executive approval for their target.
Watch this video to see how they communicate with their stakeholders internally.
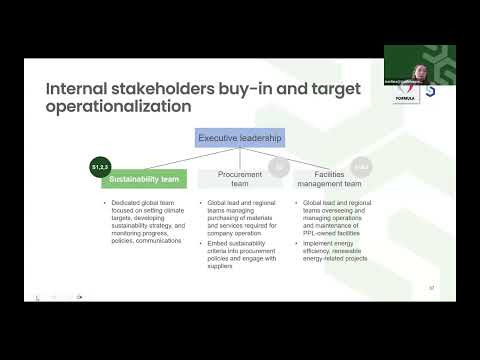
Acknowledging internal buy-in challenges
What do you see as the biggest challenges to gathering internal buy-in for your target? (Select all that apply)
Select all that apply.
This is a self-reflection question — all answers are valid. Select the options that apply to your organization.
Read: NAM Climate Journey Stage 5

Stage 5: Striving for Continuous Improvement
Stage 5: “Striving for Continuous Improvement” marks a phase where health care suppliers enhance and evolve their sustainability practices.
At this stage, organizations focus on documenting and sharing their progress, regularly evaluating emissions, embracing innovative technologies, and keeping pace with changing reporting requirements. Key actions include prioritizing both mandatory and voluntary standards, managing risks, embedding climate considerations into strategic decisions, engaging with industry groups, and transparently reporting outcomes. This ongoing commitment fosters resilience, drives innovation, and promotes accountability — paving the way toward a more sustainable future.
Actions
- Some actions you can take to continuously improve upon your climate journey:
- Create a report detailing the experience for others to use in their journey. Continuous processes that will involve assessing current emissions and making improvements based on new technology and reporting standards.
- Assess and prioritize which requirements/voluntary standards can be leveraged to build resilience. Such as a carbon tax that supports the transition to locally generated renewable energy; energy efficiency gains that lessen dependence on foreign oil; climate risk assessment and scenario analysis that highlights hot spots for acute physical risk to own operations or suppliers.
- Integrate climate-related factors into key business decisions. Including for strategy, risk management, resilience, finance and capital planning, R&D, operations (including supplier management and procurement), organization structure and talent management, pricing, marketing, and investor and government relations. Establish an inspection or audit mechanism. As initiatives are launching to meet goals, ensure measurement continues over time, and new processes are reassessed for efficiency.
- Consider joining a peer group and/or other associations and organizations. Such as the Sustainable Purchasing Leadership Council, the Action Collaborative to Decarbonize the US Health Sector Network Organization.
- Report annual progress toward Scopes 1-3 GHG emissions target.
Potential Challenges
We recognize that there can be many challenges while trying to continuously improve. Some of these challenges may include:
- Data Accuracy & Integrity: Ensuring data accuracy and integrity in sustainability reporting can be challenging, requiring robust data management systems and processes.
- Stakeholder Engagement: Engaging stakeholders effectively and maintaining ongoing communication and collaboration can be demanding, especially when dealing with diverse interests and expectations.
- Innovation and Adaptation: Continuously staying abreast of emerging sustainability trends, innovations, and best practices requires proactive learning and the ability to adapt strategies and practices accordingly.
- Resource Allocation: Allocating sufficient resources, including time, budget, and personnel, to sustainably communicate progress, findings, and learnings can be challenging, particularly when faced with other competing priorities.
Resources
Want to learn more? Click the resources below!
- The Green Print: Advancement of Environmental Sustainability in Healthcare
- Together for Sustainability (TfS) Initiative
- Understanding the Circular Economy and What Hospitals Can Do to Grow It
- SBIR and STTR Programs
- SME Climate Hub
- Sustainability Roadmap for Health Care
- Sustainable Purchasing Leadership Council
- Action Collaborative on Decarbonizing the US Health Sector - Network Organization
Click on the link below to interact with NAM Stage 5 in the Climate Journey Map.
Wrap up: Lesson 4.4
Lesson recap
Stakeholder Engagement and Alignment
- Assess abatement potential
- Engage with stakeholders on targets
- Build a business case
Leadership Buy-in
Build the storyline around your targets by answering questions about “why,” “what,” “how and how much,” and “who?” Bring together your abatement potential, key stakeholders, and business case into a leadership level discussion.
REMINDER: It is good to bring your leaders in earlier in the process to give them time to get comfortable with the targets!
NAM Climate Journey Stage 5
Through your target setting process, strive to continuously improve your practices around reducing GHG emissions.
Want to Learn More?
Click the resources below to explore further!
- The Green Print: Advancement of Environmental Sustainability in Healthcare — ScienceDirect
- Together for Sustainability (TfS) Initiative
- Understanding the Circular Economy and What Hospitals Can Do to Grow It — AMDR
- SBIR and STTR Programs
- SME Climate Hub
- Sustainability Roadmap for Health Care — American Hospital Association
- Sustainable Purchasing Leadership Council (SPLC)
- Action Collaborative on Decarbonizing the US Health Sector — NAM Climate Network Organizations